I have collected real data on the sale of a microwavable cup of soup across 20 different cities for the same time period (a month). The variables in the dataset are: Quantity sold in the city for that month: Measured in thousands of units Price: measured in dollars Average Income in the city: Measured in thousands of dollars Ads: Average number of ads run in stores for that city during that month. Price of a substitute product: measured in dollars Population of the city: measured in thousands of people The dataset is on Canvas and, using Excel or any other statistical software, please answer the following questions: 1. Describe the patterns in quantity sold and own and rival prices during this time period using basic descriptive statistics. Graphs are welcome as well. 2. Take the logs of the variables, and estimate the demand function. a. Interpret the R-square. b. Interpret the coefficients for logP and logPsub c. Interpret the p-values associated with each independent variable 3. Are consumers price sensitive? Why or why not? (be as precise as you can – you have estimates!). Does this price sensitivity make sense given the good we are examining? 4. How sensitive are our consumers to changes in the rival good’s price? Explain in detail. 5. Suppose we decide to charge a per ounce price of $2, while at the same time our rival charges a price of $2.15. All else equal, what would you expect sales to be? How confident are you in your forecast? Explain. 6. Suppose we are charging a price of $2 and our currentmarginal cost is $1.50 Are we maximizing profits at this price? If not, should we raise or lower price? Why?


Correlation
Correlation defines a relationship between two independent variables. It tells the degree to which variables move in relation to each other. When two sets of data are related to each other, there is a correlation between them.
Linear Correlation
A correlation is used to determine the relationships between numerical and categorical variables. In other words, it is an indicator of how things are connected to one another. The correlation analysis is the study of how variables are related.
Regression Analysis
Regression analysis is a statistical method in which it estimates the relationship between a dependent variable and one or more independent variable. In simple terms dependent variable is called as outcome variable and independent variable is called as predictors. Regression analysis is one of the methods to find the trends in data. The independent variable used in Regression analysis is named Predictor variable. It offers data of an associated dependent variable regarding a particular outcome.
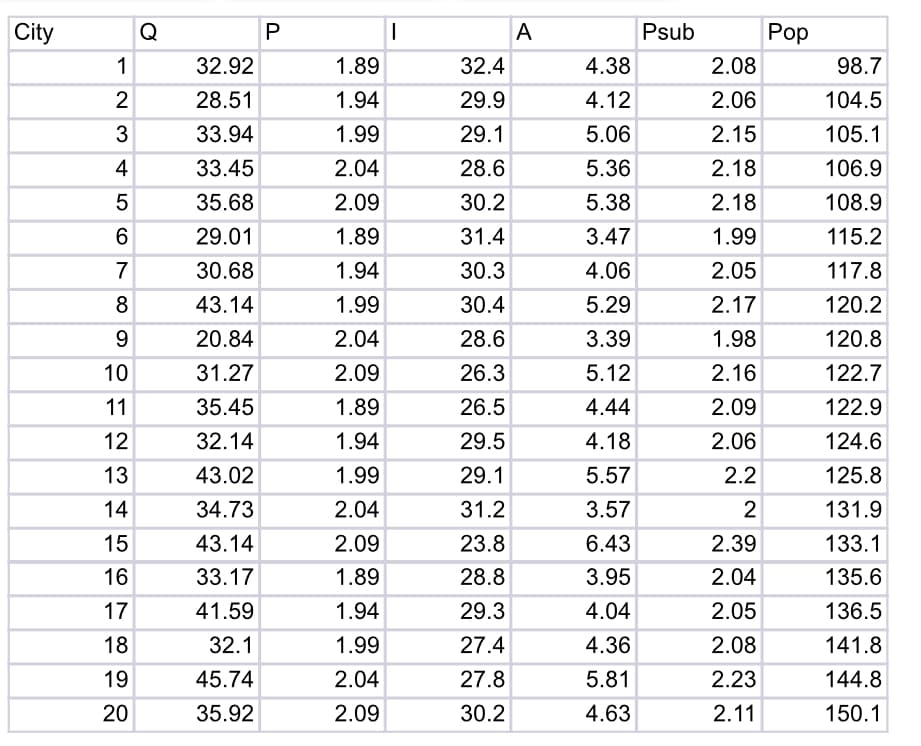
I have collected real data on the sale of a microwavable cup of soup across 20 different cities for the same time period (a month). The variables in the dataset are:
Quantity sold in the city for that month: Measured in thousands of units
Price: measured in dollars
Average Income in the city: Measured in thousands of dollars
Ads: Average number of ads run in stores for that city during that month.
Price of a substitute product: measured in dollars
Population of the city: measured in thousands of people
The dataset is on Canvas and, using Excel or any other statistical software, please answer the following questions:


Trending now
This is a popular solution!

Step by step
Solved in 2 steps with 5 images

5. Suppose we decide to charge a per ounce price of $2, while at the same time our rival charges a price of $2.15. All else equal, what would you expect sales to be? How confident are you in your forecast? How do you get P=0.07 in the solution


