Education influences attitude and lifestyle. Differences in education are a big factor in the "generation gap." Is the younger generation really better educated? Large surveys of people age 65 and older were taken in n1 = 30 U.S. cities. The sample mean for these cities showed that x1 = 15.2% of the older adults had attended college. Large surveys of young adults (age 25 - 34) were taken in n2 = 34 U.S. cities. The sample mean for these cities showed that x2 = 19.7% of the young adults had attended college. From previous studies, it is known that ?1 = 6.8% and ?2 = 4.8%. Does this information indicate that the population mean percentage of young adults who attended college is higher? Use ? = 0.05.
I need help with finding the P-value
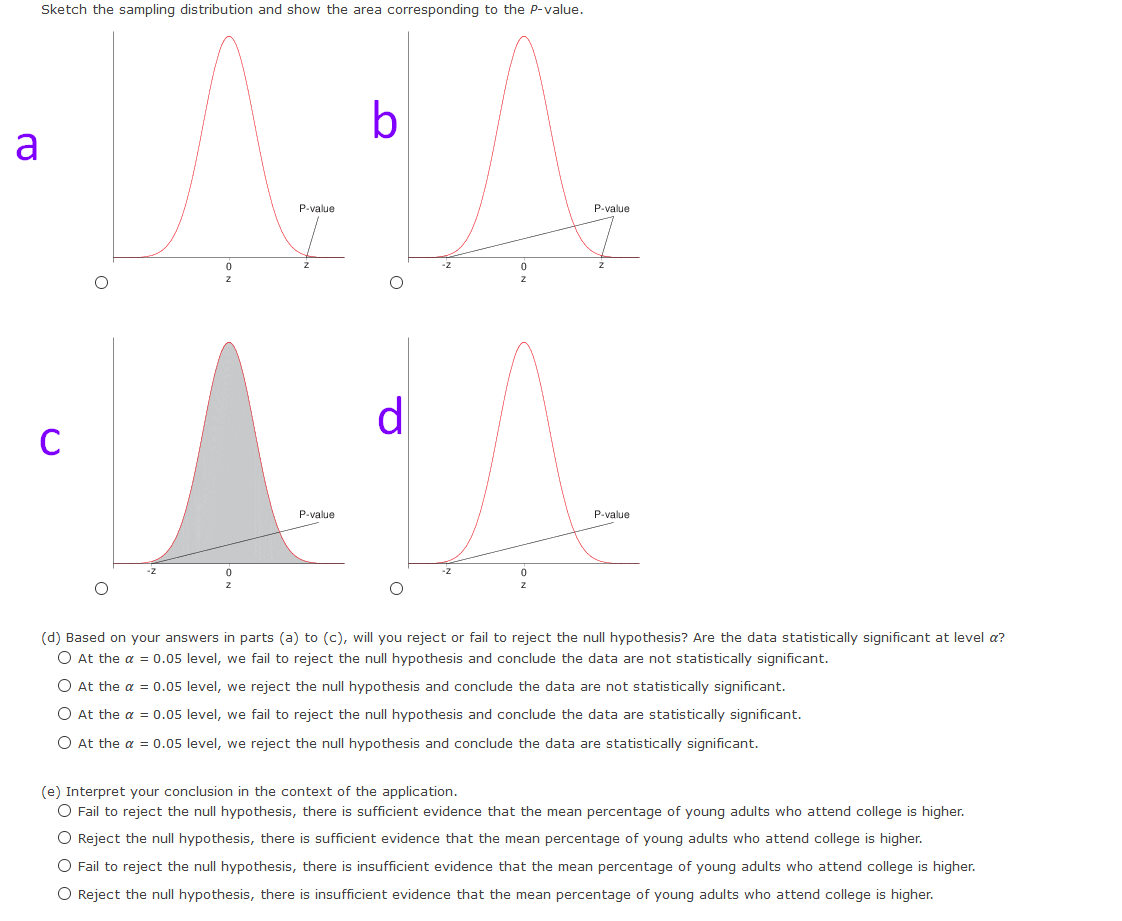
Transcribed Image Text:Sketch the sampling distribution and show the area corresponding to the P-value.
b
a
P.value
P-value
d
P-value
P-value
-z
-z
(d) Based on your answers in parts (a) to (c), will you reject or fail to reject the null hypothesis? Are the data statistically significant at level a?
O At the a = 0.05 level, we fail to reject the null hypothesis and conclude the data are not statistically significant.
At the a = 0.05 level, we reject the null hypothesis and conclude the data are not statistically significant.
O At the a = 0.05 level, we fail to reject the null hypothesis and conclude the data are statistically significant.
O At the a = 0.05 level, we reject the null hypothesis and conclude the data are statistically significant.
(e) Interpret your conclusion in the context of the application.
O Fail to reject the null hypothesis, there is sufficient evidence that the mean percentage of young adults who attend college is higher.
O Reject the null hypothesis, there is sufficient evidence that the mean percentage of young adults who attend college is higher.
O Fail to reject the null hypothesis, there is insufficient evidence that the mean percentage of young adults who attend college is higher.
O Reject the null hypothesis, there is insufficient evidence that the mean percentage of young adults who attend college is higher.
Transcribed Image Text:Education influences attitude and lifestyle. Differences in education are a big factor in the "generation gap." Is the younger generation really better educated? Large surveys of people age 65 and older were taken in n, = 30 U.S. cities. The sample mean for these
cities showed that x, = 15.2% of the older adults had attended college. Large surveys of young adults (age 25 - 34) were taken in n, = 34 U.S. cities. The sample mean for these cities showed that x, = 19.7% of the young adults had attended college. From
previous studies, it is known that o, = 6.8% ando, = 4.8%. Does this information indicate that the population mean percentage of young adults who attended college is higher? Use a = 0.05.
(a) What is the level of significance?
State the null and alternate hypotheses.
O Ho: H1 = H2i Hz: H1 < Hz
O Ho: H1 = H2i Hi: Hy # Hz
O Ho: H1 < Hzi Hi: H1 = H2
O Ho: H1 = H2i H;: H1 > Hz
(b) What sampling distribution will you use? What assumptions are you making?
O The standard normal. We assume that both population distributions are approximately normal with known standard deviations.
O The Student's t. We assume that both population distributions are approximately normal with known standard deviations.
O The Student's t. We assume that both population distributions are approximately normal with unknown standard deviations.
O The standard normal. We assume that both population distributions are approximately normal with unknown standard deviations.
What is the value of the sample test statistic? (Test the difference u, - µz. Round your answer to two decimal places.)
(c) Find (or estimate) the P-value. (Round your answer to four decimal places.)
Expert Solution
This question has been solved!
Explore an expertly crafted, step-by-step solution for a thorough understanding of key concepts.
Need a deep-dive on the concept behind this application? Look no further. Learn more about this topic, statistics and related others by exploring similar questions and additional content below.