(i) Sample of size 30 Frequency 8 7 6 5 4- 3 Frequency 2 1 0 8 (iii) Sample of size 100 25 20 15+ 10+ 5+ 0 8 9 I 10 10 11 12 (ii) Sample of size 50 Frequency 12 10 8 6 4 2 0 8 9 10 11 12 11 12 12. Interpretation The following histograms are based on different random samples of size 100 drawn from the same population. (a) Identify the midpoint of the class with the highest frequency in each of the three histograms. (b) Using the class midpoints, what is the range of data shown in each histogram? (c) Which of the histograms are more clearly skewed right? (d) Based on your study of random sample in Chapter 1, is it surprising to see the variations in the samples as displayed in the histograms? The original population from which the samples were drawn is skewed right with a high frequency near 4. Do all three random samples seem to reflect these properties equally well?
(i) Sample of size 30 Frequency 8 7 6 5 4- 3 Frequency 2 1 0 8 (iii) Sample of size 100 25 20 15+ 10+ 5+ 0 8 9 I 10 10 11 12 (ii) Sample of size 50 Frequency 12 10 8 6 4 2 0 8 9 10 11 12 11 12 12. Interpretation The following histograms are based on different random samples of size 100 drawn from the same population. (a) Identify the midpoint of the class with the highest frequency in each of the three histograms. (b) Using the class midpoints, what is the range of data shown in each histogram? (c) Which of the histograms are more clearly skewed right? (d) Based on your study of random sample in Chapter 1, is it surprising to see the variations in the samples as displayed in the histograms? The original population from which the samples were drawn is skewed right with a high frequency near 4. Do all three random samples seem to reflect these properties equally well?

College Algebra (MindTap Course List)
12th Edition
ISBN:9781305652231
Author:R. David Gustafson, Jeff Hughes
Publisher:R. David Gustafson, Jeff Hughes
Chapter8: Sequences, Series, And Probability
Section8.7: Probability
Problem 58E: What is meant by the sample space of an experiment?

Related questions
Question
Please show work!! Answer this question correctly. Thanks.
Transcribed Image Text:(i) Sample of size 30
Frequency
6
5
Frequency
4
3
2
1
0
(iii) Sample of size 100
25
20
15
10
5+
0
8
9
9
L
10
10
11
12
12
(ii) Sample of size 50
Frequency
12
10
8
6
4
2
0
7
8
9
10
11
12
11
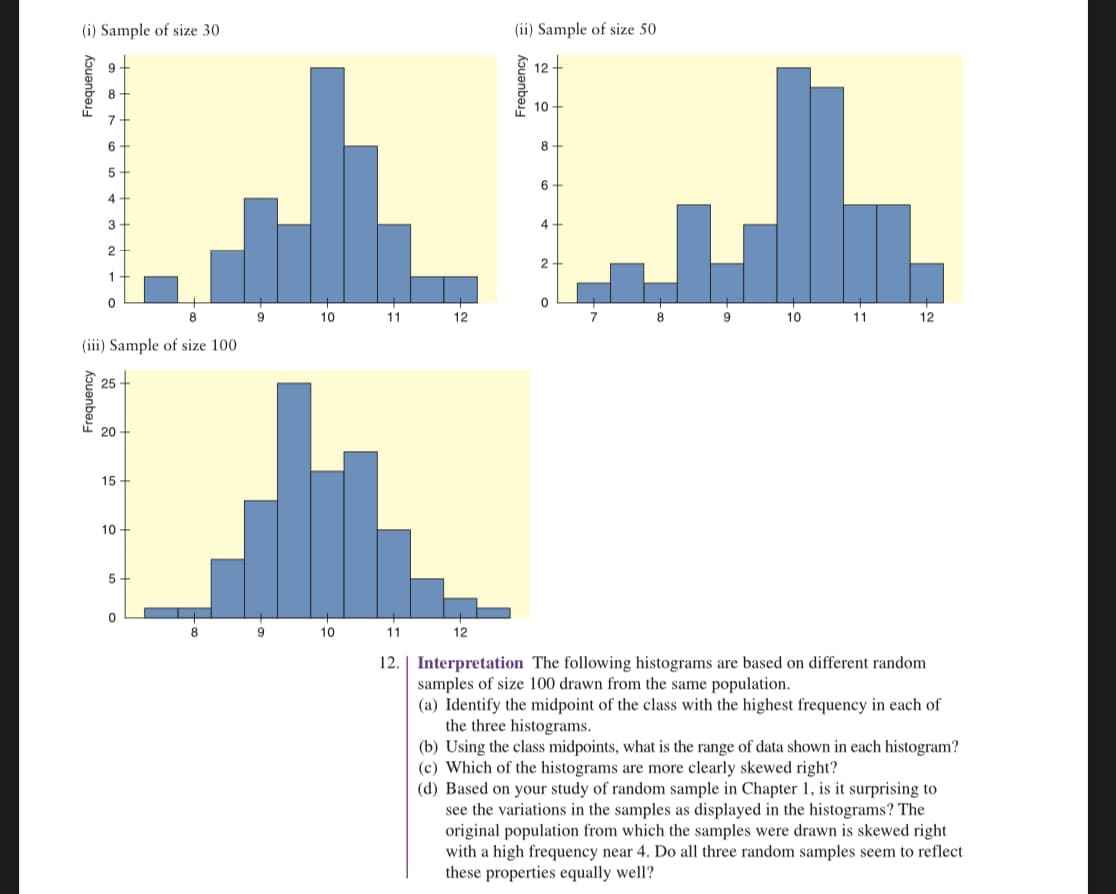
12. Interpretation The following histograms are based on different random
samples of size 100 drawn from the same population.
(a) Identify the midpoint of the class with the highest frequency in each of
the three histograms.
(b) Using the class midpoints, what is the range of data shown in each histogram?
(c) Which of the histograms are more clearly skewed right?
(d) Based on your study of random sample in Chapter 1, is it surprising to
see the variations in the samples as displayed in the histograms? The
original population from which the samples were drawn is skewed right
with a high frequency near 4. Do all three random samples seem to reflect
these properties equally well?
Expert Solution
This question has been solved!
Explore an expertly crafted, step-by-step solution for a thorough understanding of key concepts.

This is a popular solution!

Trending now
This is a popular solution!

Step by step
Solved in 6 steps with 7 images

Recommended textbooks for you
College Algebra (MindTap Course List)
Algebra
ISBN:
9781305652231
Author:
R. David Gustafson, Jeff Hughes
Publisher:
Cengage Learning
College Algebra (MindTap Course List)
Algebra
ISBN:
9781305652231
Author:
R. David Gustafson, Jeff Hughes
Publisher:
Cengage Learning