I want to know if the average weight of a steak frie(s) or individual steak fried potato the same weight as a crinkle cut frie(s) or individual crinkle cut fried potato. Weighing fries from a large bag of steak fries recorded weights are 0.6, 0.8, 1.1, 0.3 and 1.3 ounces. Weighing fries from a large bag of crinkle cut fries recorded weights are 1.5, 2, 1.6, 0.9 and 2.1 ounces. I assume a random sample. Let u1 = mean weight of steak fries Let u2 - mean weight of crinkle cut fries H0: u1 − u2 = 0 H1: u1 − u2 ≠0 Let's test at the 0.05 level of significance Based on the value of the test statistic would we reject or fail to reject the null hypothesis?


I want to know if the average weight of a steak frie(s) or individual steak fried potato the same weight as a crinkle cut frie(s) or individual crinkle cut fried potato. Weighing fries from a large bag of steak fries recorded weights are 0.6, 0.8, 1.1, 0.3 and 1.3 ounces. Weighing fries from a large bag of crinkle cut fries recorded weights are 1.5, 2, 1.6, 0.9 and 2.1 ounces. I assume a random sample.
Let u1 = mean weight of steak fries
Let u2 - mean weight of crinkle cut fries
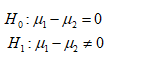
H0: u1 − u2 = 0
H1: u1 − u2 ≠0
Let's test at the 0.05 level of significance
Based on the value of the test statistic would we reject or fail to reject the null hypothesis?
The null and alternative hypotheses are given below:
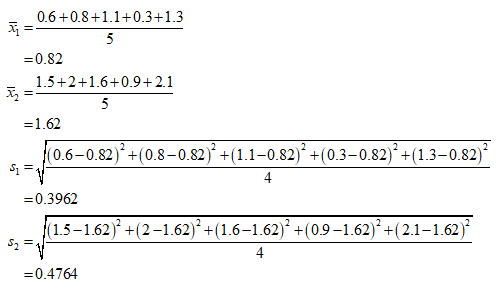
The sample mean and sample standard deviation are computed as follows:
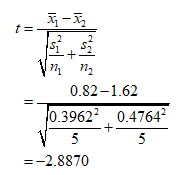
Since, the population standard deviation is not known and the sample size is small, t distribution is appropriate for this scenario.
The test statistic is calculated as follows:

Step by step
Solved in 6 steps with 3 images


