I was given a graphing activity. It was do with the measuring the reaction rate against temperature. As you can see in the images below when I plotted them it required to be a curved graph. My question is when you have to graph data like the worksheets attached do you simple go through each one or do you have to do something like a curve of best fit. I was also required to interpolate missing data Specifically I had to graph the rate of reaction which was measured at mm/s against temperautre. This was for a biology test. The data point were similar to these worksheets in the sense that none of the data points were overlapping they were clearly separated and at different height. So in biology would I simply go through each one or do you have to do something like a curve of best fit. I was also required to interpolate missing data BTW this subject was biology.


Enzyme kinetics
In biochemistry, enzymes are proteins that act as biological catalysts. Catalysis is the addition of a catalyst to a chemical reaction to speed up the pace of the reaction. Catalysis can be categorized as either homogeneous or heterogeneous, depending on whether the catalysts are distributed in the same phase as that of the reactants. Enzymes are an essential part of the cell because, without them, many organic processes would slow down and thus will affect the processes that are important for cell survival and sustenance.
Regulation of Enzymes
A substance that acts as a catalyst to regulate the reaction rate in the living organism's metabolic pathways without itself getting altered is an enzyme. Most of the biological reactions and metabolic pathways in the living systems are carried out by enzymes. They are specific for their works and work in particular conditions. It maintains the best possible rate of reaction in the most stable state. The enzymes have distinct properties as they can proceed with the reaction in any direction, their particular binding sites, pH specificity, temperature specificity required in very few amounts.
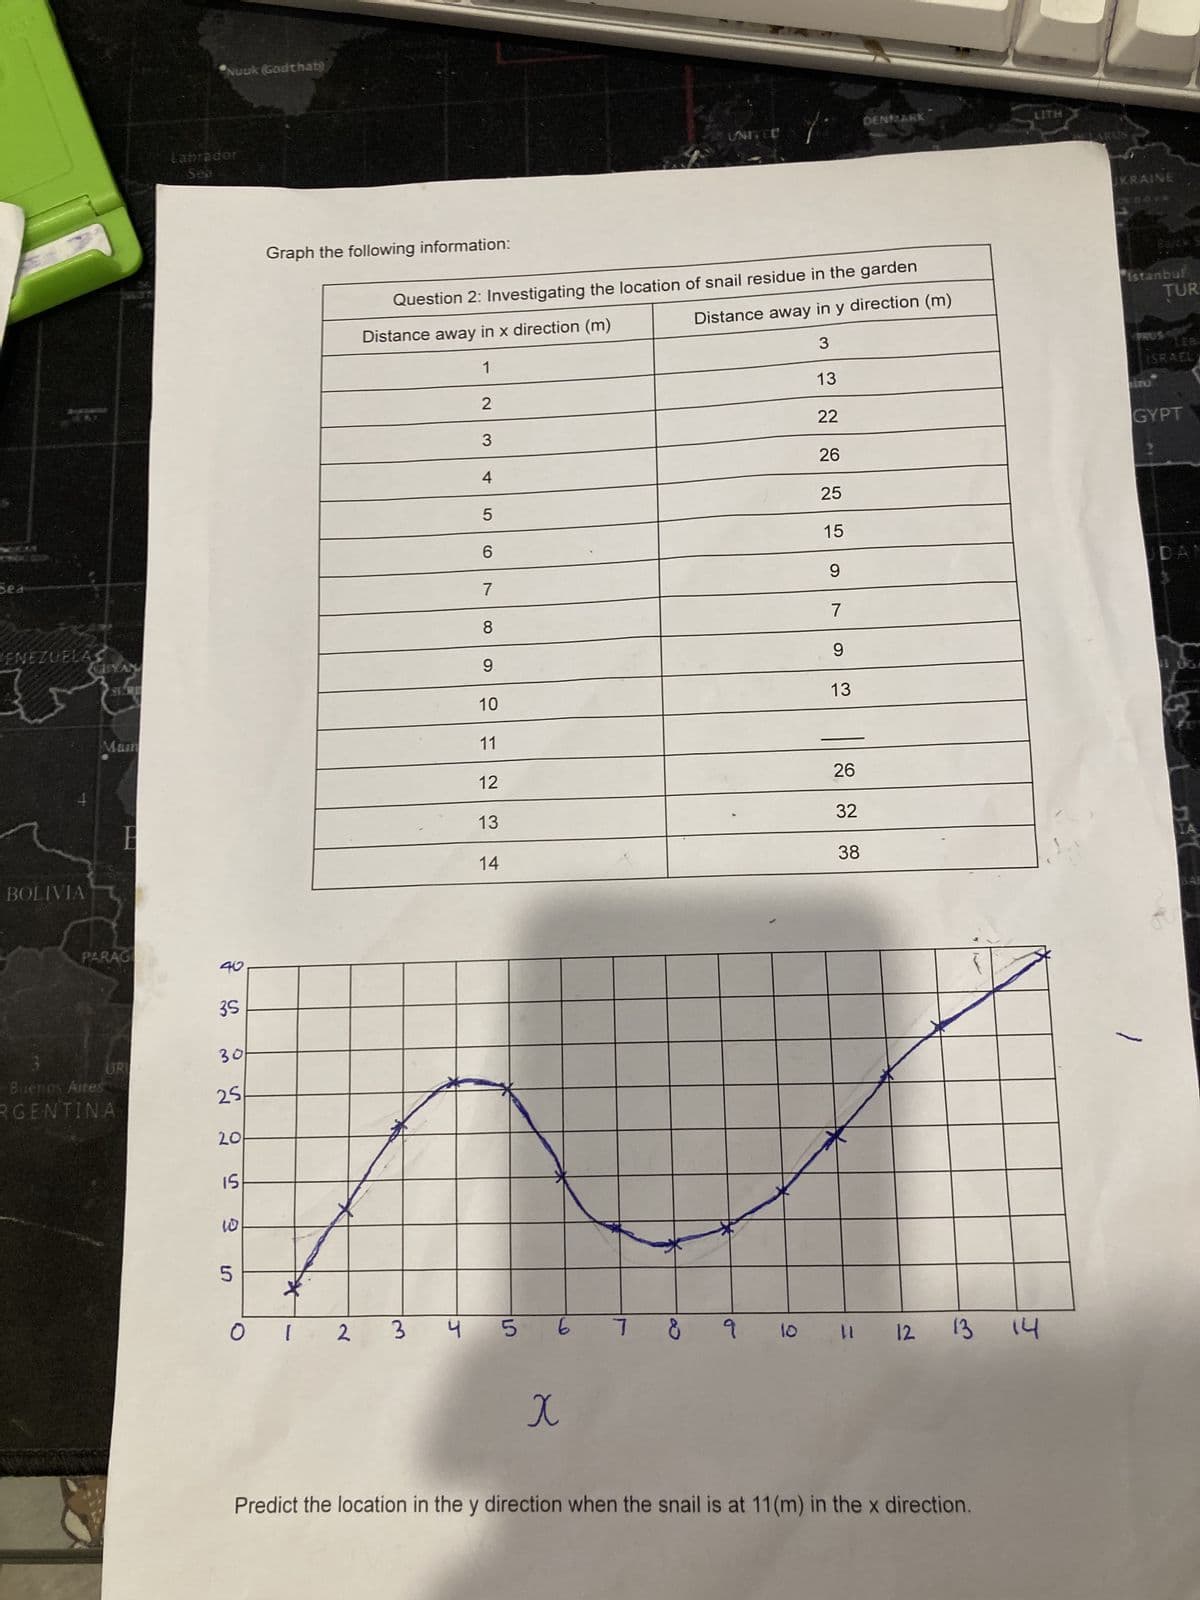
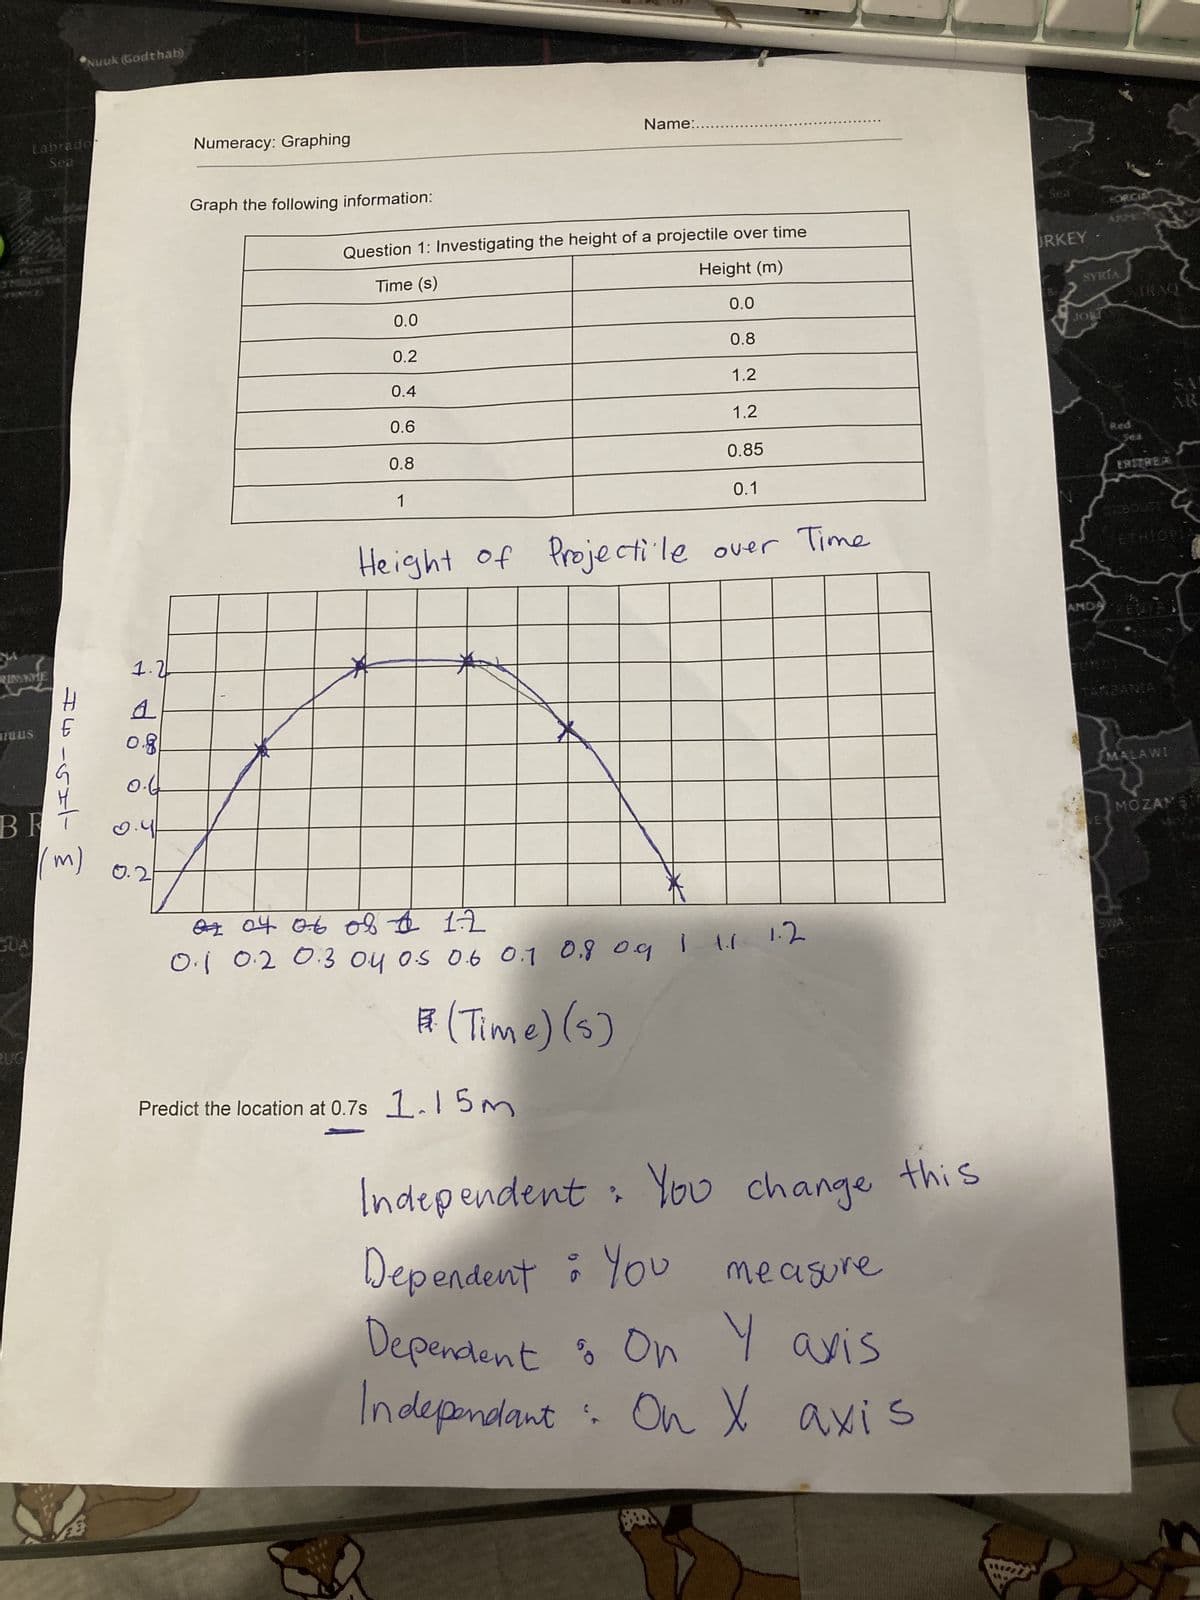
I was given a graphing activity. It was do with the measuring the reaction rate against temperature. As you can see in the images below when I plotted them it required to be a curved graph. My question is when you have to graph data like the worksheets attached do you simple go through each one or do you have to do something like a curve of best fit. I was also required to interpolate missing data
Specifically I had to graph the
So in biology would I simply go through each one or do you have to do something like a curve of best fit. I was also required to interpolate missing data
BTW this subject was biology.

Step by step
Solved in 3 steps


