images attached

Glencoe Algebra 1, Student Edition, 9780079039897, 0079039898, 2018
18th Edition
ISBN:9780079039897
Author:Carter
Publisher:Carter
Chapter10: Statistics
Section10.3: Measures Of Spread
Problem 1GP

Related questions
Question
images attached
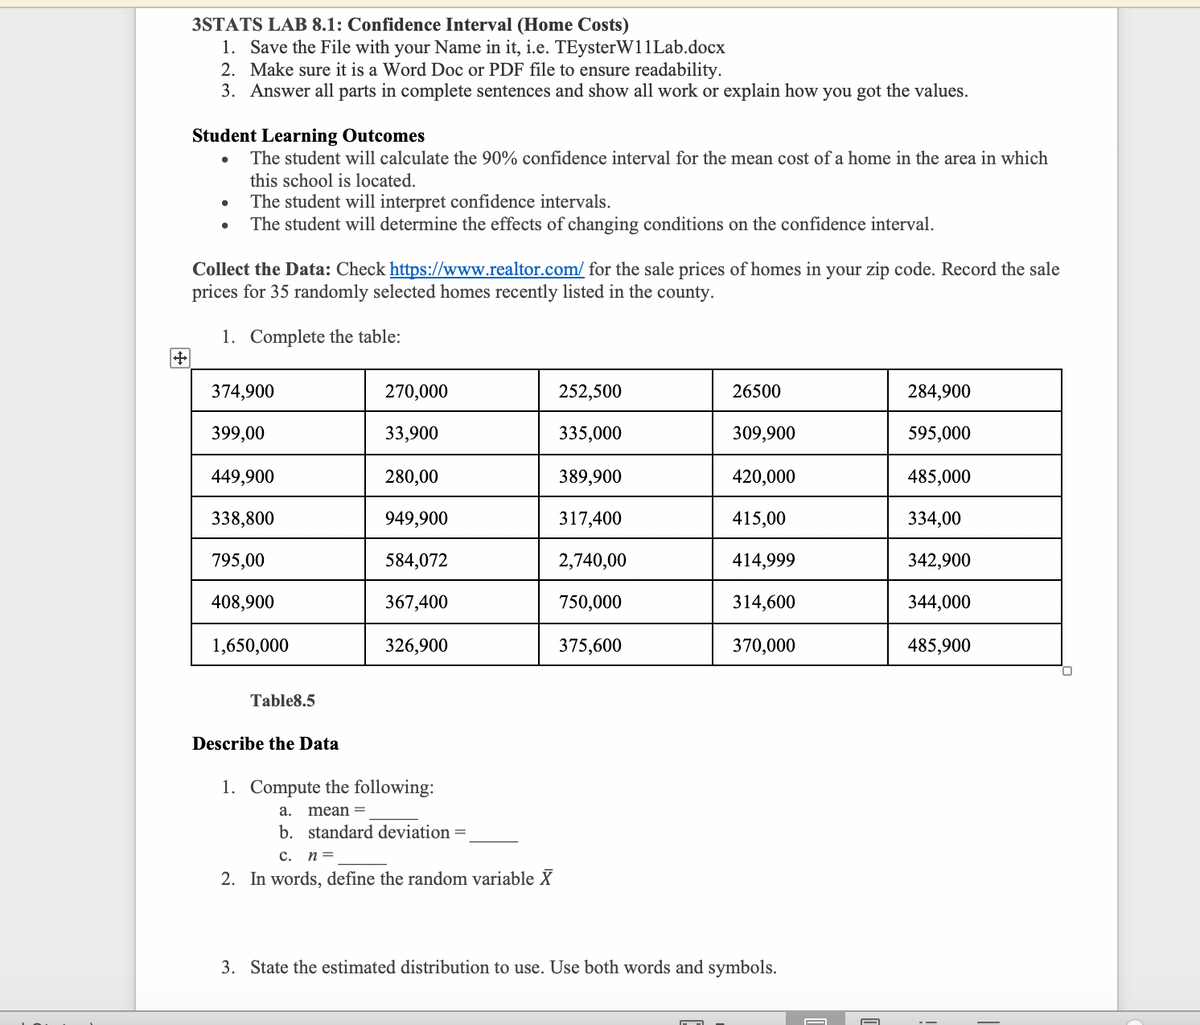
Transcribed Image Text:3STATS LAB 8.1: Confidence Interval (Home Costs)
1. Save the File with your Name in it, i.e. TEysterW11Lab.docx
2. Make sure it is a Word Doc or PDF file to ensure readability.
3. Answer all parts in complete sentences and show all work or explain how you got the values.
Student Learning Outcomes
The student will calculate the 90% confidence interval for the mean cost of a home in the area in which
this school is located.
The student will interpret confidence intervals.
The student will determine the effects of changing conditions on the confidence interval.
Collect the Data: Check https://www.realtor.com/ for the sale prices of homes in your zip code. Record the sale
prices for 35 randomly selected homes recently listed in the county.
1. Complete the table:
374,900
270,000
252,500
26500
284,900
399,00
33,900
335,000
309,900
595,000
449,900
280,00
389,900
420,000
485,000
338,800
949,900
317,400
415,00
334,00
795,00
584,072
2,740,00
414,999
342,900
408,900
367,400
750,000
314,600
344,000
1,650,000
326,900
375,600
370,000
485,900
Table8.5
Describe the Data
1. Compute the following:
а.
mean =
b. standard deviation =
c.
n =
2. In words, define the random variable X
3. State the estimated distribution to use. Use both words and symbols.
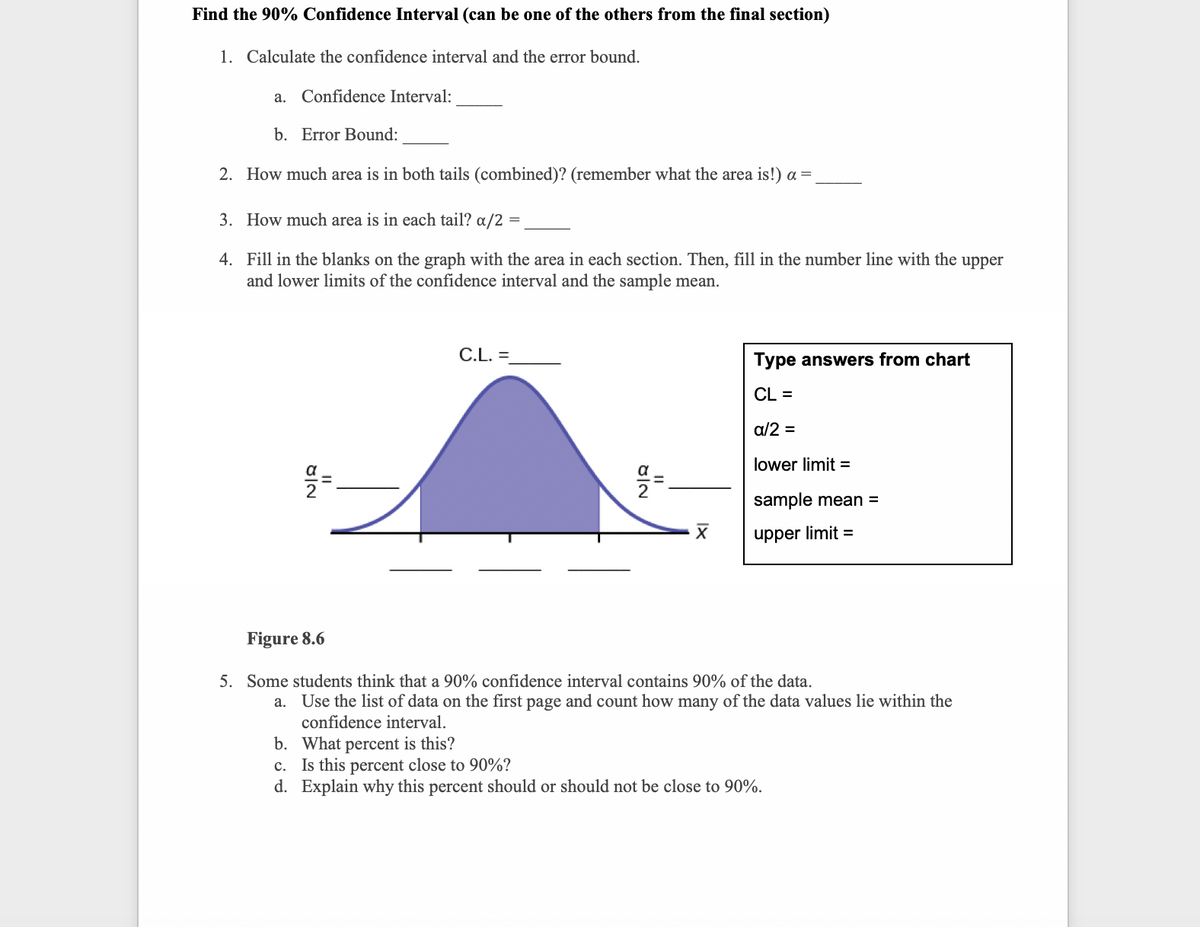
Transcribed Image Text:Find the 90% Confidence Interval (can be one of the others from the final section)
1. Calculate the confidence interval and the error bound.
a. Confidence Interval:
b. Error Bound:
2. How much area is in both tails (combined)? (remember what the area is!) a =
3. How much area is in each tail? a/2 =
4. Fill in the blanks on the graph with the area in each section. Then, fill in the number line with the upper
and lower limits of the confidence interval and the sample mean.
C.L. =
Type answers from chart
CL =
a/2 =
lower limit =
sample mean =
upper limit =
Figure 8.6
5. Some students think that a 90% confidence interval contains 90% of the data.
a. Use the list of data on the first page and count how many of the data values lie within the
confidence interval.
b. What percent is this?
c. Is this percent close to 90%?
d. Explain why this percent should or should not be close to 90%.
Expert Solution
This question has been solved!
Explore an expertly crafted, step-by-step solution for a thorough understanding of key concepts.

This is a popular solution!

Trending now
This is a popular solution!

Step by step
Solved in 4 steps

Knowledge Booster


Learn more about
Need a deep-dive on the concept behind this application? Look no further. Learn more about this topic, statistics and related others by exploring similar questions and additional content below.Recommended textbooks for you
Glencoe Algebra 1, Student Edition, 9780079039897…
Algebra
ISBN:
9780079039897
Author:
Carter
Publisher:
McGraw Hill
Glencoe Algebra 1, Student Edition, 9780079039897…
Algebra
ISBN:
9780079039897
Author:
Carter
Publisher:
McGraw Hill