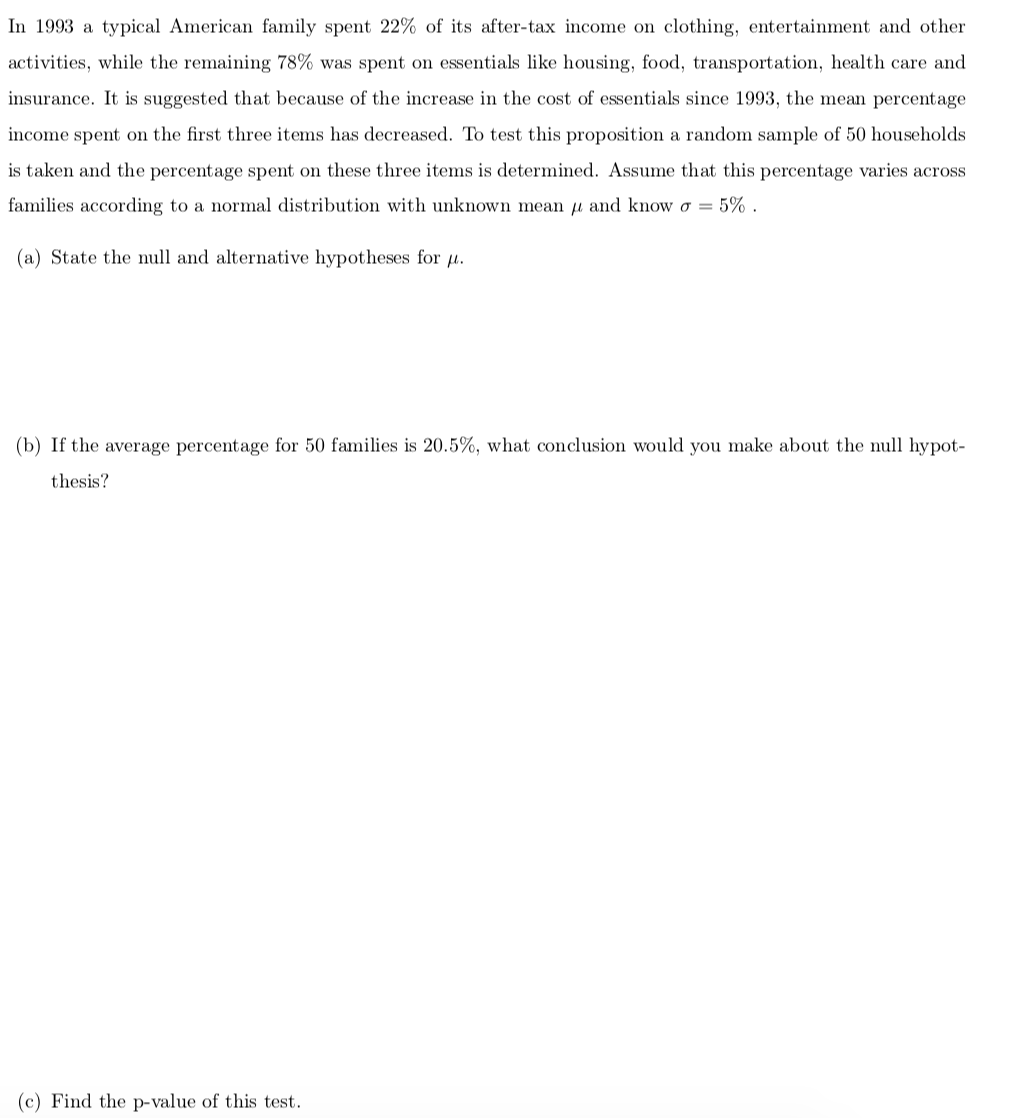
In 1993 a typical American family spent 22% of its after-tax income on clothing, entertainment and other activities, while the remaining 78% was spent on essentials like housing, food, transportation, health care and insurance. It is suggested that because of the increase in the cost of essentials since 1993, the mean percentage income spent on the first three items has decreased. To test this proposition a random sample of 50 households is taken and the percentage spent on these three items is determined. Assume that this percentage varies across families according to a normal distribution with unknown mean u and know o = 5% . (a) State the null and alternative hypotheses for u. (b) If the average percentage for 50 families is 20.5%, what conclusion would you make about the null hypot- thesis? (c) Find the p-value of this test.
In 1993 a typical American family spent 22% of its after-tax income on clothing, entertainment and other activities, while the remaining 78% was spent on essentials like housing, food, transportation, health care and insurance. It is suggested that because of the increase in the cost of essentials since 1993, the mean percentage income spent on the first three items has decreased. To test this proposition a random sample of 50 households is taken and the percentage spent on these three items is determined. Assume that this percentage varies across families according to a normal distribution with unknown mean u and know o = 5% . (a) State the null and alternative hypotheses for u. (b) If the average percentage for 50 families is 20.5%, what conclusion would you make about the null hypot- thesis? (c) Find the p-value of this test.
Glencoe Algebra 1, Student Edition, 9780079039897, 0079039898, 2018
18th Edition
ISBN:9780079039897
Author:Carter
Publisher:Carter
Chapter10: Statistics
Section10.6: Summarizing Categorical Data
Problem 30PPS
Related questions
Topic Video
Question
100%
Question is attached

Transcribed Image Text:In 1993 a typical American family spent 22% of its after-tax income on clothing, entertainment and other
activities, while the remaining 78% was spent on essentials like housing, food, transportation, health care and
insurance. It is suggested that because of the increase in the cost of essentials since 1993, the mean percentage
income spent on the first three items has decreased. To test this proposition a random sample of 50 households
is taken and the percentage spent on these three items is determined. Assume that this percentage varies across
families according to a normal distribution with unknown mean u and know o = 5% .
(a) State the null and alternative hypotheses for u.
(b) If the average percentage for 50 families is 20.5%, what conclusion would you make about the null hypot-
thesis?
(c) Find the p-value of this test.
Expert Solution
Trending now
This is a popular solution!
Step by step
Solved in 9 steps with 4 images

Knowledge Booster
Learn more about
Need a deep-dive on the concept behind this application? Look no further. Learn more about this topic, probability and related others by exploring similar questions and additional content below.Recommended textbooks for you

Glencoe Algebra 1, Student Edition, 9780079039897…
Algebra
ISBN:
9780079039897
Author:
Carter
Publisher:
McGraw Hill

College Algebra (MindTap Course List)
Algebra
ISBN:
9781305652231
Author:
R. David Gustafson, Jeff Hughes
Publisher:
Cengage Learning

Glencoe Algebra 1, Student Edition, 9780079039897…
Algebra
ISBN:
9780079039897
Author:
Carter
Publisher:
McGraw Hill

College Algebra (MindTap Course List)
Algebra
ISBN:
9781305652231
Author:
R. David Gustafson, Jeff Hughes
Publisher:
Cengage Learning