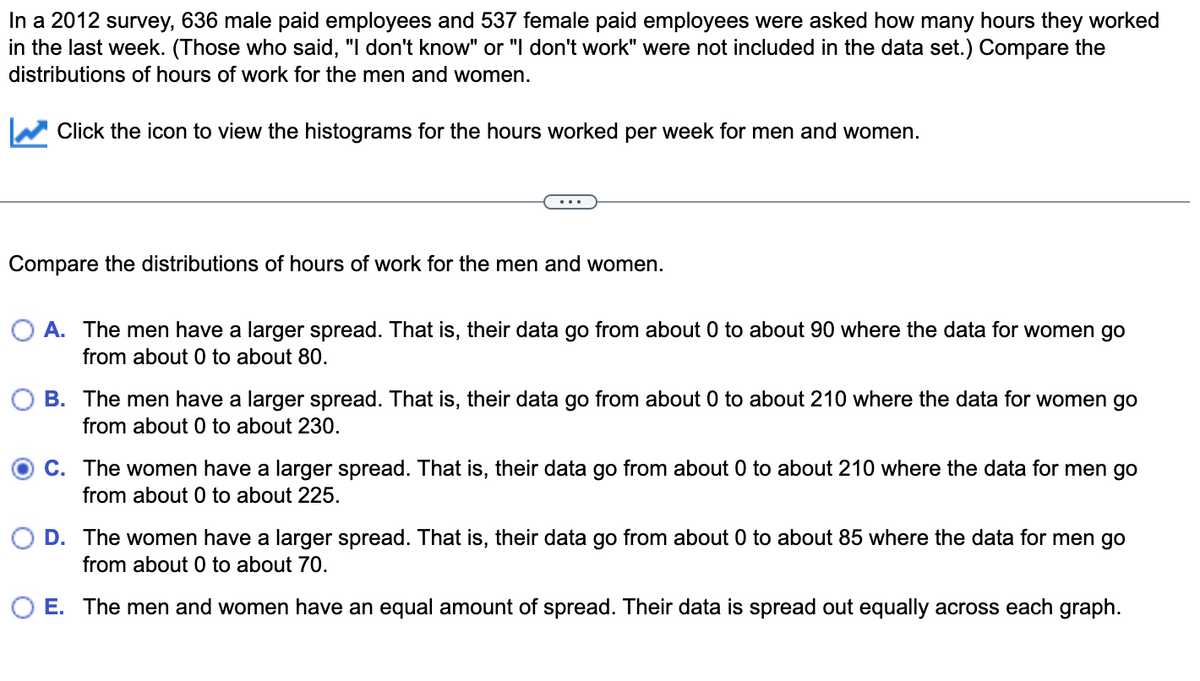
In a 2012 survey, 636 male paid employees and 537 female paid employees were asked how many hours they worked in the last week. (Those who said, "I don't know" or "I don't work" were not included in the data set.) Compare the distributions of hours of work for the men and women. ✔ Click the icon to view the histograms for the hours worked per week for men and women. Compare the distributions of hours of work for the men and women. A. The men have a larger spread. That is, their data go from about 0 to about 90 where the data for women go from about 0 to about 80. B. The men have a larger spread. That is, their data go from about 0 to about 210 where the data for women go from about 0 to about 230. C. The women have a larger spread. That is, their data go from about 0 to about 210 where the data for men go from about 0 to about 225. D. The women have a larger spread. That is, their data go from about 0 to about 85 where the data for men go from about 0 to about 70. O E. The men and women have an equal amount of spread. Their data is spread out equally across each graph.
In a 2012 survey, 636 male paid employees and 537 female paid employees were asked how many hours they worked in the last week. (Those who said, "I don't know" or "I don't work" were not included in the data set.) Compare the distributions of hours of work for the men and women. ✔ Click the icon to view the histograms for the hours worked per week for men and women. Compare the distributions of hours of work for the men and women. A. The men have a larger spread. That is, their data go from about 0 to about 90 where the data for women go from about 0 to about 80. B. The men have a larger spread. That is, their data go from about 0 to about 210 where the data for women go from about 0 to about 230. C. The women have a larger spread. That is, their data go from about 0 to about 210 where the data for men go from about 0 to about 225. D. The women have a larger spread. That is, their data go from about 0 to about 85 where the data for men go from about 0 to about 70. O E. The men and women have an equal amount of spread. Their data is spread out equally across each graph.

Glencoe Algebra 1, Student Edition, 9780079039897, 0079039898, 2018
18th Edition
ISBN:9780079039897
Author:Carter
Publisher:Carter
Chapter10: Statistics
Section: Chapter Questions
Problem 25SGR

Related questions
Question
Transcribed Image Text:In a 2012 survey, 636 male paid employees and 537 female paid employees were asked how many hours they worked
in the last week. (Those who said, "I don't know" or "I don't work" were not included in the data set.) Compare the
distributions of hours of work for the men and women.
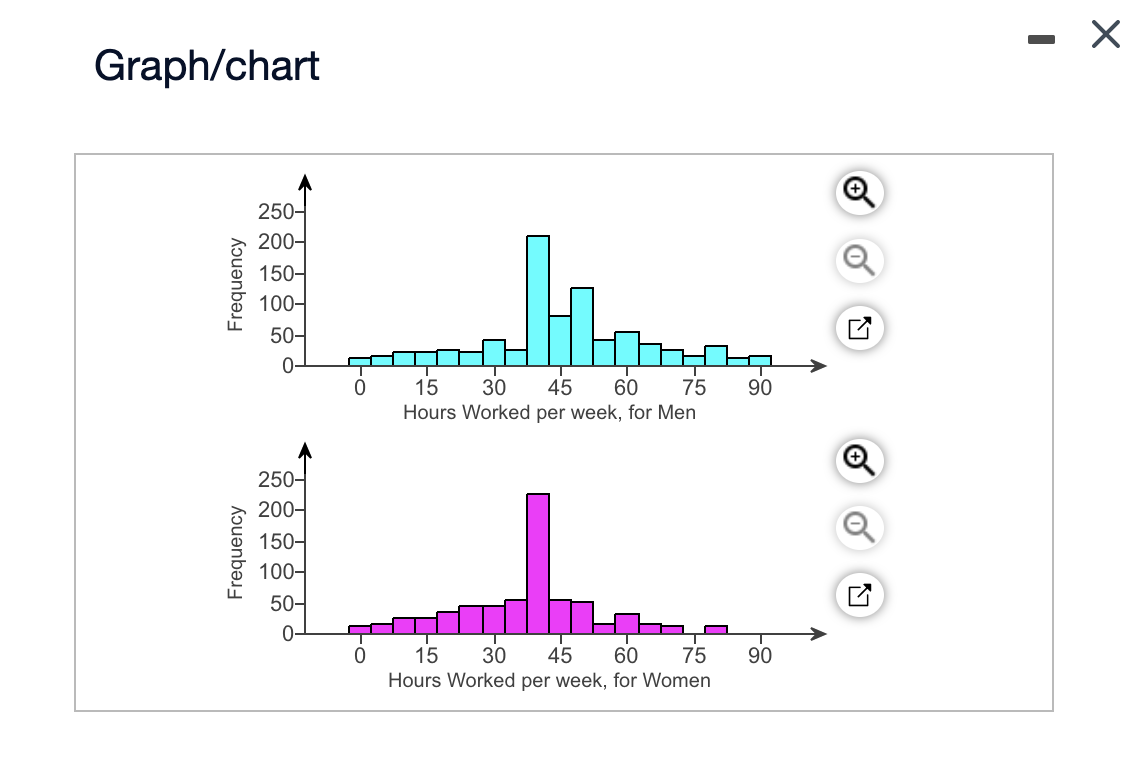
Click the icon to view the histograms for the hours worked per week for men and women.
Compare the distributions of hours of work for the men and women.
O A. The men have a larger spread. That is, their data go from about 0 to about 90 where the data for women go
from about 0 to about 80.
B. The men have a larger spread. That is, their data go from about 0 to about 210 where the data for women go
from about 0 to about 230.
OC. The women have a larger spread. That is, their data go from about 0 to about 210 where the data for men go
from about 0 to about 225.
D. The women have a larger spread. That is, their data go from about 0 to about 85 where the data for men go
from about 0 to about 70.
E. The men and women have an equal amount of spread. Their data is spread out equally across each graph.
Transcribed Image Text:Graph/chart
Frequency
Frequency
250-
200-
150-
100-
50-
0-
250-
200-
150-
100-
50-
0-
0
0
T
15 30 45 60 75
Hours Worked per week, for Men
15 30 45 60 75
Hours Worked per week, for Women
90
90
Q
X
Expert Solution
This question has been solved!
Explore an expertly crafted, step-by-step solution for a thorough understanding of key concepts.

This is a popular solution!

Trending now
This is a popular solution!

Step by step
Solved in 3 steps

Recommended textbooks for you
Glencoe Algebra 1, Student Edition, 9780079039897…
Algebra
ISBN:
9780079039897
Author:
Carter
Publisher:
McGraw Hill

Holt Mcdougal Larson Pre-algebra: Student Edition…
Algebra
ISBN:
9780547587776
Author:
HOLT MCDOUGAL
Publisher:
HOLT MCDOUGAL
Glencoe Algebra 1, Student Edition, 9780079039897…
Algebra
ISBN:
9780079039897
Author:
Carter
Publisher:
McGraw Hill
Holt Mcdougal Larson Pre-algebra: Student Edition…
Algebra
ISBN:
9780547587776
Author:
HOLT MCDOUGAL
Publisher:
HOLT MCDOUGAL