In a 2018 study, Phoenix Marketing International identified Bridgeport, Connecticut; San Jose, California; Washington, DC; and Lexington Park, Maryland, as the four U.S. cities with the highest percentage of millionaires (Kiplinger website). Consider a sample of data that show the following number of millionaires for samples of individuals from each of the four cities. City Bridgeport, San Jose, Washington, Lexington Park, Millionaire ст CA D.C. MD Yes 44 35 36 35 No 456 265 364 365 a. What is the estimate of the percentage of millionaires in each of these cities (to 1 decimal)? Bridgeport, San Jose, Washington, Lexington Park, CT CA D.C. MD Percentage, % 8.80 11.67 9.00 8.50 b. Using a = 0.05 level of significance, test for the equality of the population proportion of millionaires for these four cities. What is the p-value? Compute the value of the x? test statistic (to 3 decimals). Use Table 3 of Appendix B to find the p-value. The p-value is greater than 0.10 What is your conclusion? Cannot conclude : that there is a difference among the population proportion of millionaires for these four cities.
In a 2018 study, Phoenix Marketing International identified Bridgeport, Connecticut; San Jose, California; Washington, DC; and Lexington Park, Maryland, as the four U.S. cities with the highest percentage of millionaires (Kiplinger website). Consider a sample of data that show the following number of millionaires for samples of individuals from each of the four cities. City Bridgeport, San Jose, Washington, Lexington Park, Millionaire ст CA D.C. MD Yes 44 35 36 35 No 456 265 364 365 a. What is the estimate of the percentage of millionaires in each of these cities (to 1 decimal)? Bridgeport, San Jose, Washington, Lexington Park, CT CA D.C. MD Percentage, % 8.80 11.67 9.00 8.50 b. Using a = 0.05 level of significance, test for the equality of the population proportion of millionaires for these four cities. What is the p-value? Compute the value of the x? test statistic (to 3 decimals). Use Table 3 of Appendix B to find the p-value. The p-value is greater than 0.10 What is your conclusion? Cannot conclude : that there is a difference among the population proportion of millionaires for these four cities.

Glencoe Algebra 1, Student Edition, 9780079039897, 0079039898, 2018
18th Edition
ISBN:9780079039897
Author:Carter
Publisher:Carter
Chapter10: Statistics
Section10.6: Summarizing Categorical Data
Problem 10CYU

Related questions
Question
Looking for B
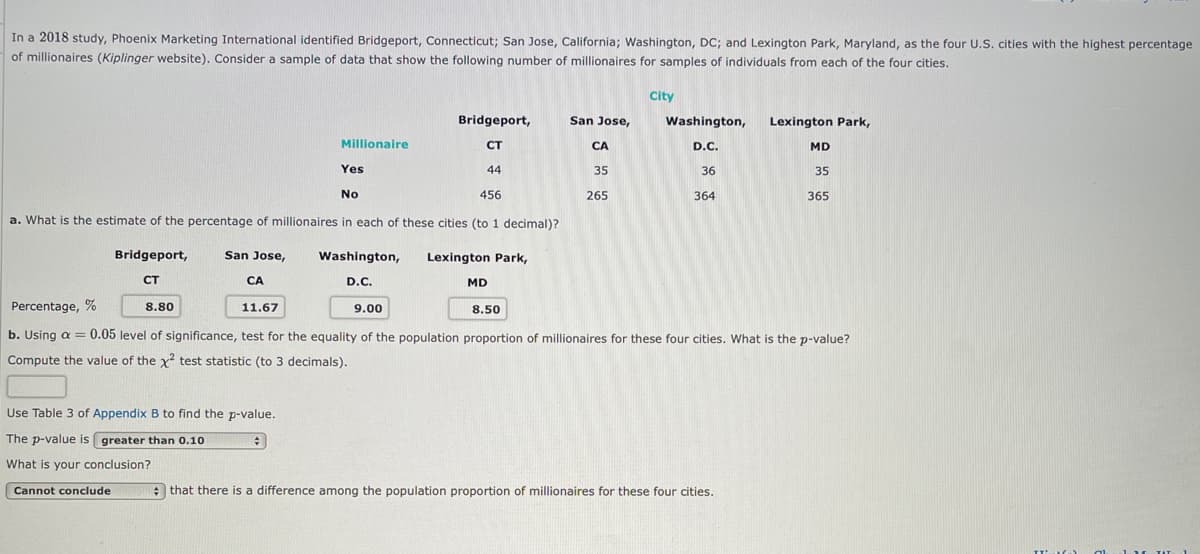
Transcribed Image Text:In a 2018 study, Phoenix Marketing International identified Bridgeport, Connecticut; San Jose, California; Washington, DC; and Lexington Park, Maryland, as the four U.S. cities with the highest percentage
of millionaires (Kiplinger website). Consider a sample of data that show the following number of millionaires for samples of individuals from each of the four cities.
City
Bridgeport,
San Jose,
Washington,
Lexington Park,
Millionaire
CT
CA
D.C.
MD
Yes
44
35
36
35
No
456
265
364
365
a. What is the estimate of the percentage of millionaires in each of these cities (to 1 decimal)?
Bridgeport,
San Jose,
Washington,
Lexington Park,
CT
CA
D.C.
MD
Percentage, %
8.80
11.67
9.00
8.50
b. Using a = 0.05 level of significance, test for the equality of the population proportion of millionaires for these four cities. What is the p-value?
Compute the value of the x? test statistic (to 3 decimals).
Use Table 3 of Appendix B to find the p-value.
The p-value is greater than 0.10
What is your conclusion?
Cannot conclude
: that there is a difference among the population proportion of millionaires for these four cities.
1. M TAT
Expert Solution
This question has been solved!
Explore an expertly crafted, step-by-step solution for a thorough understanding of key concepts.

This is a popular solution!

Trending now
This is a popular solution!

Step by step
Solved in 3 steps with 3 images

Knowledge Booster


Learn more about
Need a deep-dive on the concept behind this application? Look no further. Learn more about this topic, statistics and related others by exploring similar questions and additional content below.Recommended textbooks for you
Glencoe Algebra 1, Student Edition, 9780079039897…
Algebra
ISBN:
9780079039897
Author:
Carter
Publisher:
McGraw Hill

Holt Mcdougal Larson Pre-algebra: Student Edition…
Algebra
ISBN:
9780547587776
Author:
HOLT MCDOUGAL
Publisher:
HOLT MCDOUGAL

College Algebra (MindTap Course List)
Algebra
ISBN:
9781305652231
Author:
R. David Gustafson, Jeff Hughes
Publisher:
Cengage Learning
Glencoe Algebra 1, Student Edition, 9780079039897…
Algebra
ISBN:
9780079039897
Author:
Carter
Publisher:
McGraw Hill
Holt Mcdougal Larson Pre-algebra: Student Edition…
Algebra
ISBN:
9780547587776
Author:
HOLT MCDOUGAL
Publisher:
HOLT MCDOUGAL
College Algebra (MindTap Course List)
Algebra
ISBN:
9781305652231
Author:
R. David Gustafson, Jeff Hughes
Publisher:
Cengage Learning
