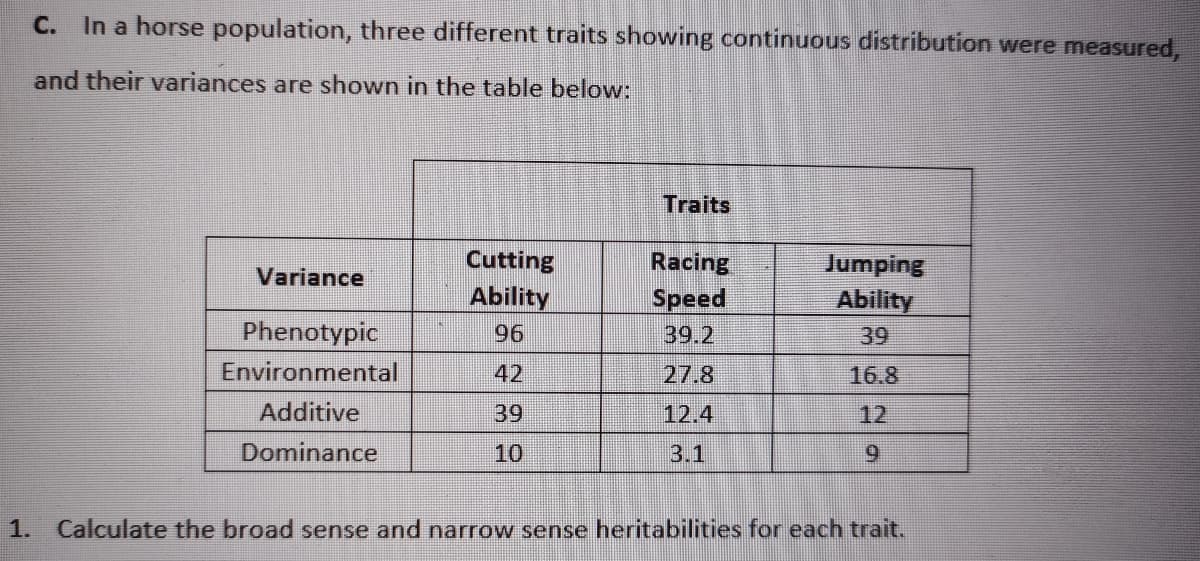
In a horse population, three different traits showing continuous distribution were measured, and their variances are shown in the table below:

Human Heredity: Principles and Issues (MindTap Course List)
11th Edition
ISBN:9781305251052
Author:Michael Cummings
Publisher:Michael Cummings
Chapter18: Genetics Of Behavior
Section18.2: Models, Methods, And Phenotypes In Studying Behavior
Problem 1EG: What role would twin and adoption studies play in selecting a model for determining whether...
icon
Related questions
Question
C. In a horse population, three different traits showing continuous distribution were measured,
and their variances are shown in the table below:
Traits
Cutting
Racing
Speed
Jumping
Variance
Ability
Ability
Phenotypic
96
39.2
39
Environmental
42
27.8
16.8
Additive
39
12.4
12
Dominance
10
3.1
9.
1.
Calculate the broad sense and narrow sense heritabilities for each trait.
Transcribed Image Text:C. In a horse population, three different traits showing continuous distribution were measured, and their variances are shown in the table below: Traits Cutting Racing Speed Jumping Variance Ability Ability Phenotypic 96 39.2 39 Environmental 42 27.8 16.8 Additive 39 12.4 12 Dominance 10 3.1 9. 1. Calculate the broad sense and narrow sense heritabilities for each trait.
Expert Solution
trending now

Trending now

This is a popular solution!

steps

Step by step

Solved in 3 steps

Blurred answer
Knowledge Booster
Genetic variation
Learn more about
Need a deep-dive on the concept behind this application? Look no further. Learn more about this topic, biology and related others by exploring similar questions and additional content below.
Similar questions
  • SEE MORE QUESTIONS
Recommended textbooks for you
Human Heredity: Principles and Issues (MindTap Co…
Biology
ISBN:
9781305251052
Author:
Michael Cummings
Publisher:
Cengage Learning