In a hypothesis test with hypotheses Ho : µ = 24 and H1 : µ # 24, a random sample of 38 elements selected from the population produced a mean of 26.0. Assume that o = 4.4, and that the test is to be made at the 5% significance level. What is the p-value for this hypothesis test, rounded to four decimal places?
In a hypothesis test with hypotheses Ho : µ = 24 and H1 : µ # 24, a random sample of 38 elements selected from the population produced a mean of 26.0. Assume that o = 4.4, and that the test is to be made at the 5% significance level. What is the p-value for this hypothesis test, rounded to four decimal places?

Holt Mcdougal Larson Pre-algebra: Student Edition 2012
1st Edition
ISBN:9780547587776
Author:HOLT MCDOUGAL
Publisher:HOLT MCDOUGAL
Chapter11: Data Analysis And Probability
Section: Chapter Questions
Problem 8CR

Related questions
Question
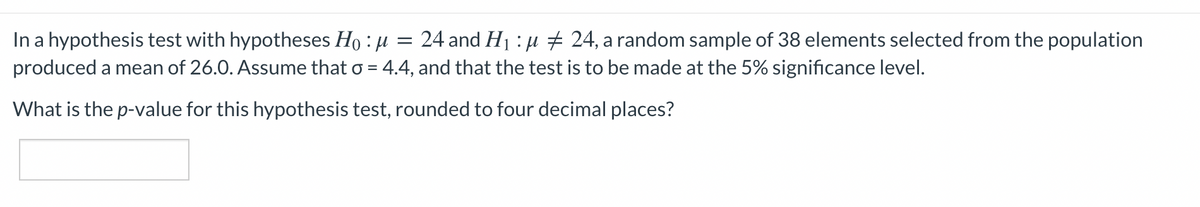
Transcribed Image Text:In a hypothesis test with hypotheses Ho : µ
produced a mean of 26.0. Assume that o = 4.4, and that the test is to be made at the 5% significance level.
24 and H1 : µ + 24, a random sample of 38 elements selected from the population
What is the p-value for this hypothesis test, rounded to four decimal places?
Expert Solution
This question has been solved!
Explore an expertly crafted, step-by-step solution for a thorough understanding of key concepts.

This is a popular solution!

Trending now
This is a popular solution!

Step by step
Solved in 2 steps

Recommended textbooks for you
Holt Mcdougal Larson Pre-algebra: Student Edition…
Algebra
ISBN:
9780547587776
Author:
HOLT MCDOUGAL
Publisher:
HOLT MCDOUGAL
Holt Mcdougal Larson Pre-algebra: Student Edition…
Algebra
ISBN:
9780547587776
Author:
HOLT MCDOUGAL
Publisher:
HOLT MCDOUGAL