In a study of speed dating, female subjects were asked to rate the attractiveness of their male dates, and a sample of the results is listed below (1 = not attractive; 10 = extremely attractive). Find the range, variance, and standard deviation for the given sample data. Can the results be used to describe the variation among attractiveness ratings for the population of adult males? 8 4 3 4 3 4 4 3 4 10 4 4 4 The range of the sample data is 9 (Round to one decimal place as needed.) The standard deviation of the sample data is 2.5 (Round to one decimal place as needed.) The variance of the sample data is 6.1 (Round to one decimal place as needed.) Can the results be used to describe the variation among attractiveness ratings for the population of adult males? A. Since it is likely that the male subjects volunteered to participate in speed dating, they may not be representative of all adult males. Therefore, the results cannot be used to describe the population. B. It is unlikely that a random sample of adult males can be representative of all adult males. Therefore, the results cannot be used to describe the population. C. The results cannot be used to describe the population because a smaller sample would be needed. D. The results can be used to describe the population because the sample is random. (1,1) More
In a study of speed dating, female subjects were asked to rate the attractiveness of their male dates, and a sample of the results is listed below (1 = not attractive; 10 = extremely attractive). Find the range, variance, and standard deviation for the given sample data. Can the results be used to describe the variation among attractiveness ratings for the population of adult males? 8 4 3 4 3 4 4 3 4 10 4 4 4 The range of the sample data is 9 (Round to one decimal place as needed.) The standard deviation of the sample data is 2.5 (Round to one decimal place as needed.) The variance of the sample data is 6.1 (Round to one decimal place as needed.) Can the results be used to describe the variation among attractiveness ratings for the population of adult males? A. Since it is likely that the male subjects volunteered to participate in speed dating, they may not be representative of all adult males. Therefore, the results cannot be used to describe the population. B. It is unlikely that a random sample of adult males can be representative of all adult males. Therefore, the results cannot be used to describe the population. C. The results cannot be used to describe the population because a smaller sample would be needed. D. The results can be used to describe the population because the sample is random. (1,1) More

MATLAB: An Introduction with Applications
6th Edition
ISBN:9781119256830
Author:Amos Gilat
Publisher:Amos Gilat
Chapter1: Starting With Matlab
Section: Chapter Questions
Problem 1P

Related questions

Topic Video
Question
Can you assist me in answering this? I do not receive results, and it would be helpful to know if I am on the right track to study for midterms.
(this is not graded but, rather, an excersice conducive to acquisition).
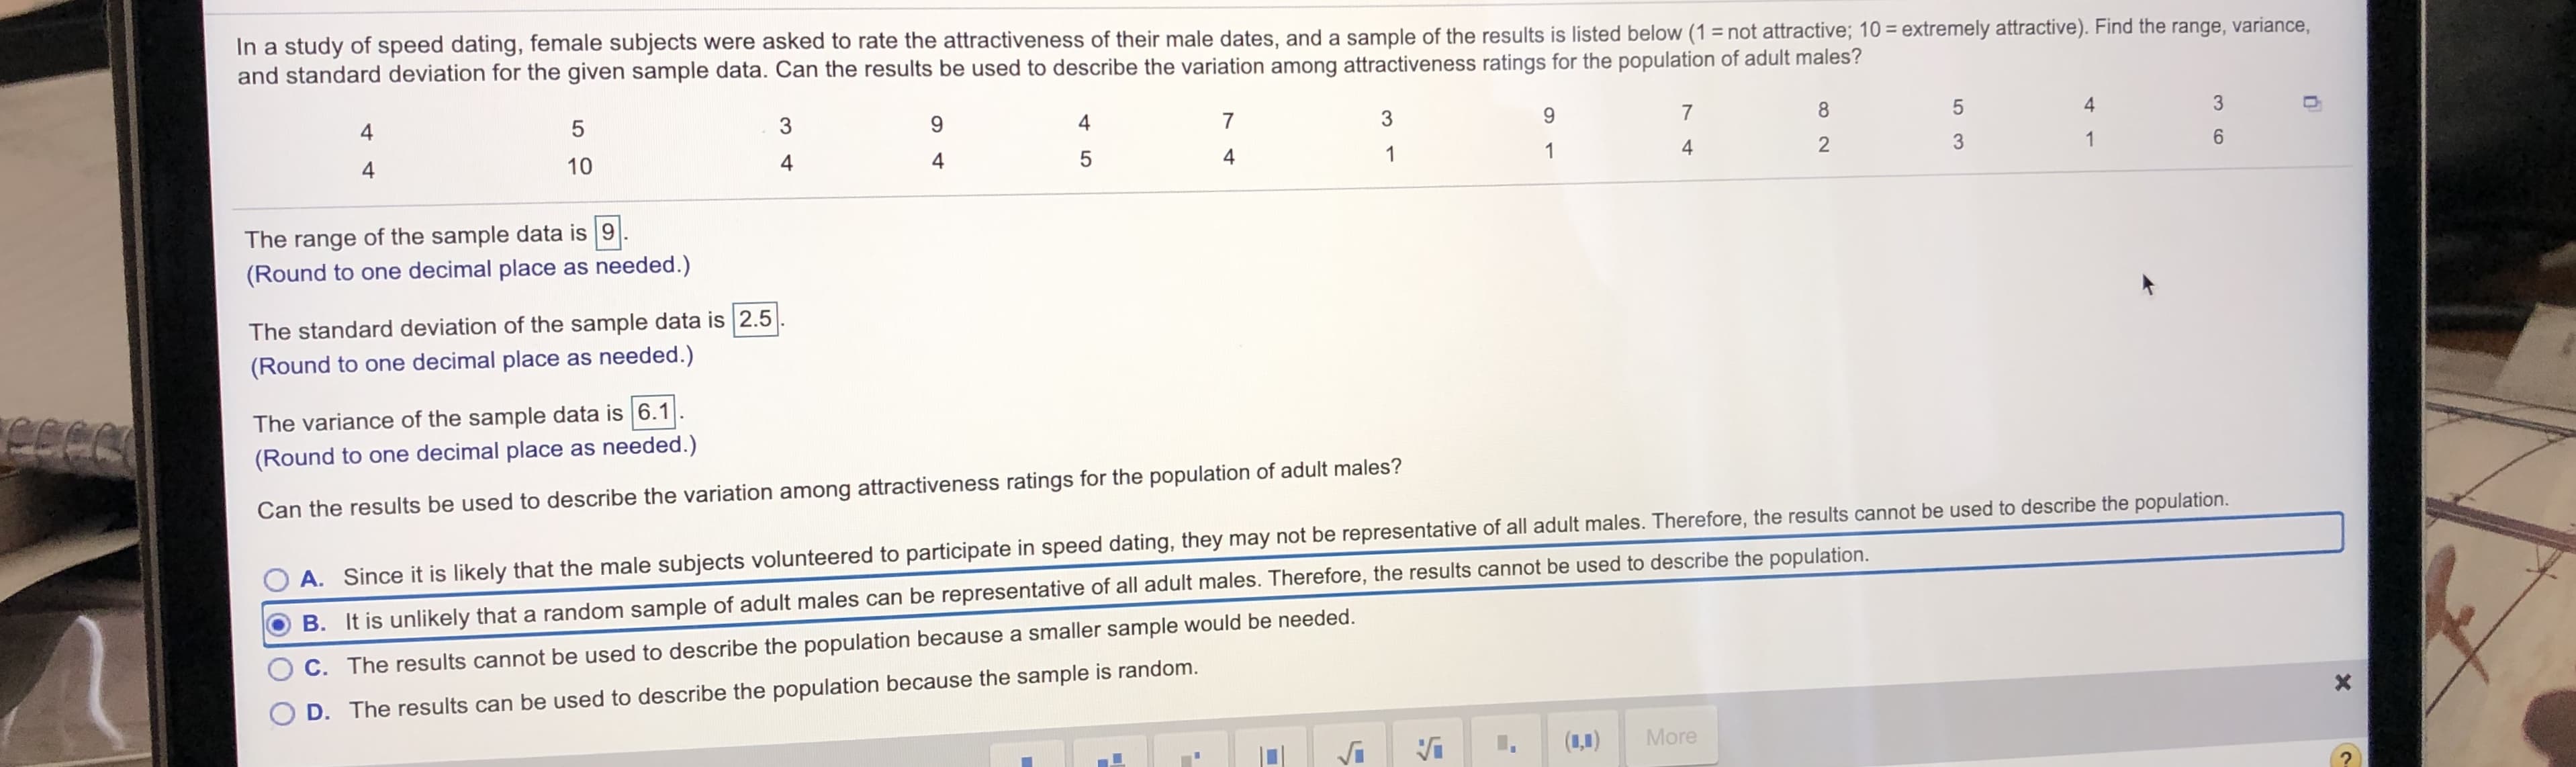
Transcribed Image Text:In a study of speed dating, female subjects were asked to rate the attractiveness of their male dates, and a sample of the results is listed below (1 = not attractive; 10 = extremely attractive). Find the range, variance,
and standard deviation for the given sample data. Can the results be used to describe the variation among attractiveness ratings for the population of adult males?
8
4
3
4
3
4
4
3
4
10
4
4
4
The range of the sample data is 9
(Round to one decimal place as needed.)
The standard deviation of the sample data is 2.5
(Round to one decimal place as needed.)
The variance of the sample data is 6.1
(Round to one decimal place as needed.)
Can the results be used to describe the variation among attractiveness ratings for the population of adult males?
A. Since it is likely that the male subjects volunteered to participate in speed dating, they may not be representative of all adult males. Therefore, the results cannot be used to describe the population.
B. It is unlikely that a random sample of adult males can be representative of all adult males. Therefore, the results cannot be used to describe the population.
C. The results cannot be used to describe the population because a smaller sample would be needed.
D. The results can be used to describe the population because the sample is random.
(1,1)
More
Expert Solution
This question has been solved!
Explore an expertly crafted, step-by-step solution for a thorough understanding of key concepts.

This is a popular solution!

Trending now
This is a popular solution!

Step by step
Solved in 3 steps with 6 images

Knowledge Booster


Learn more about
Need a deep-dive on the concept behind this application? Look no further. Learn more about this topic, statistics and related others by exploring similar questions and additional content below.Recommended textbooks for you
MATLAB: An Introduction with Applications
Statistics
ISBN:
9781119256830
Author:
Amos Gilat
Publisher:
John Wiley & Sons Inc

Probability and Statistics for Engineering and th…
Statistics
ISBN:
9781305251809
Author:
Jay L. Devore
Publisher:
Cengage Learning

Statistics for The Behavioral Sciences (MindTap C…
Statistics
ISBN:
9781305504912
Author:
Frederick J Gravetter, Larry B. Wallnau
Publisher:
Cengage Learning
MATLAB: An Introduction with Applications
Statistics
ISBN:
9781119256830
Author:
Amos Gilat
Publisher:
John Wiley & Sons Inc
Probability and Statistics for Engineering and th…
Statistics
ISBN:
9781305251809
Author:
Jay L. Devore
Publisher:
Cengage Learning
Statistics for The Behavioral Sciences (MindTap C…
Statistics
ISBN:
9781305504912
Author:
Frederick J Gravetter, Larry B. Wallnau
Publisher:
Cengage Learning

Elementary Statistics: Picturing the World (7th E…
Statistics
ISBN:
9780134683416
Author:
Ron Larson, Betsy Farber
Publisher:
PEARSON

The Basic Practice of Statistics
Statistics
ISBN:
9781319042578
Author:
David S. Moore, William I. Notz, Michael A. Fligner
Publisher:
W. H. Freeman

Introduction to the Practice of Statistics
Statistics
ISBN:
9781319013387
Author:
David S. Moore, George P. McCabe, Bruce A. Craig
Publisher:
W. H. Freeman