In an experiment to assess the effect of listening to audiobooks while driving, participants were asked to drive down a straight road in a driving simulator. The accompanying data on time (in milliseconds) to react when a pedestrian walked into the street for 10 drivers listening to an audiobook are consistent with summary statistics and graphs that appeared in the paper "Good Distractions: Testing the Effect of Listening to an Audiobook on Driving Performance in Simple and Complex Road Environments."+ (Round your answers to four decimal places.) 1,018 1,009 1,056 986 937 1,030 1,065 1,013 862 1,108 USE SALT Calculate the variance for this data set. 4310.6360 x Calculate the standard deviation for this data set. 69.1234
Q: Claims made follow a Poisson Process with rate of 9 per year. There are two type of claims, with 70%…
A: Claims follow a Poisson distribution with rate of 9 per year i.e., .Type I claim is 70%.For Type I…
Q: 74% of owned dogs in the United States are spayed or neutered. Round your answers to four decimal…
A: sample size(n)=45p=0.74Let "x" be the no. of dogs are spayed or neuteredx~Binomial(n=45 ,…
Q: forD, E, and F I have the following and want to see if correct: D=0.9579 E=14 F= var(x)=4.2 std…
A: number of trails (n)=20Probability of success (p)=0.70X~B(n=20, p=0.70)We have to…
Q: 3. (Discrete distributions, From a recent statistical analysis for the last five years, on an…
A: In this question, we are considering the occurrence of air accidents in a randomly selected month.…
Q: A researcher looking for evidence of extrasensory perception (ESP) tests 1000 subjects. Forty-three…
A: In the quest to explore the possibility of extrasensory perception (ESP), a researcher conducted a…
Q: In a study of speed dating, male subjects were asked to rate the attractiveness of their female…
A: The question is about confidence intervalGiven :To find :1 ) 90 % CI for the popl. mean2 ) What does…
Q: What is the probability that a fair six-sided die, rolled 10,000 times, will result in an outcome…
A:
Q: mean You want to estimate the mean weight loss of people one year after using the Atkins diet. How…
A: Population standard deviation()=10.8 lbMargin of error(E)=0.20 lb
Q: 1. Look for the 2020 population pyramid of the Philippines. Describe the a. age composition b. Sex…
A: The pop. pyramid shows the breakdown of age and gender at a given point in time.
Q: O. Use a 0.01 significance level to test the claim that peanut M&M candies have weights that vary…
A: Use a 0.01 significance level to test the claim that peanut M&M candies have weights that vary…
Q: Q1 Create a scatter diagram for the two variables and display regression equation and coefficient of…
A: Consider the given Information:Average Annual SalaryStress…
Q: Testing a claim about a proportion: In a sample random poll of 514 human resource professionals, 236…
A:
Q: 4-2 Moments of the white noise response of a scalar linear system. Consider the system (t)=ar(t) +…
A: Introduction:In this problem, we are given a system described by the equation , where represents…
Q: The following table shows the number of hours some middle school students in two cities spend…
A: The two datasets are given as-City ACity B9627201726241521231225251425141811
Q: a. Por lo menos cuatro canales no estén en uso. b. Que entre dos y tres canales estén en uso. c. Que…
A: AS PER GUIDELINES I HAVE CALCULATED FIRST MAIN QUESTION , PLZ REPOST FOR REMAINING . A fast food…
Q: a. Set up the null and alternative hypothesis (using mathematical notation/numbers and interpret…
A: A numerical value calculated from sample data in a hypothesis test that helps determine the strength…
Q: Other Senior Screen Time, AJ's Screen Time and Difference (AJ-Others) 150 100 50 -50 12 Other Senior…
A: The graphs are used to visualize the nature of the given dataset using the pattern that is obtained…
Q: A researcher wants to know about the effect of building area on house prices on the slopes of Mount…
A: Building AreaHouse Prices160250170320220325240410120220120200180310120280160320140240
Q: Construct a Venn diagram to represent your assigned problem. Include capital letter labels for all…
A: A survey of outdoor recreation enthusiasts had 5,238 responses.Group 1: responders who are…
Q: The correlation in the data image below is ... O positive, but not +1. zero. none of the above.…
A: Relationship between two variables is depicted
Q: 68 randomly selected car salespersons were asked the number of cars they generally sell in one week.…
A: No. of people answered that they generally sell 3 cars = 11No. of people answered that they…
Q: hat the following data are taken from a study conducted by the National Park System, of which Death…
A: We have given data are 146,151,169,174,194,178,183,194,178,178,169,164,151,142
Q: 17) The mean height of twenty-three 5-year-old children is 100 cm and the standard deviation is 6…
A: The sample size is 23, the sample mean is 100 and the sample standard deviation is 6.
Q: Match these values of r with the accompanying scatterplots: 1, -0.997, 0.364,-1, and -0.721. Click…
A: Scatter plot:A Scatterplot displays the relationship between 2 numeric variables. Each dot…
Q: Find the indicated probability. Round your answer to four decimals. 13) Assume that math tutor…
A: Mean()=$600.50Standard deviation()=$20.60
Q: Question content area topPart 1Which of the following is NOT needed to determine the minimum sample…
A: The question is about sample size estimateionIntroduction :The formula for min. sample size to…
Q: a) b) Durbin-Watson test is a procedure which is utilised to check whether the errors ('s) on a time…
A: We have given, (a) Durbin-Watson test is a procedure which is utilized to check whether the errors…
Q: The following data represent salaries, in thousands of dollars, for employees of a small company.…
A: Given data set:
Q: Determine whether each pair of actions results in independent or dependent events. Pick one marble…
A: Dependent and independent events in statistics relate to the link between two or more occurrences…
Q: A random variable y is assumed to follow a uniform distribution for values 20 ≤ x ≤ 30. Values of X…
A:
Q: Suppose one has $1 now, and wants to win an additional dollars, where N~ Poisson(A). He tosses a…
A: Title: Analysis of a Stochastic Game: Winning Dollars with a Fair CoinIntroduction:In this problem,…
Q: Which of the following graphs uses vertical bars? O circle graphs O frequency polygons O pictographs…
A: The circle graph is also known as a pie where each sector represents the percentage of each…
Q: The following data are the scores of 19 students on an algebra test. 62 , 84 , 87 , 92 , 55 ,…
A: 62,84,87,92,55,75,85,63,58,70,60,86,95,61,92,65,84,75,64sample size(n)=19Arrange the data in…
Q: At a high school, 7 students volunteer for a committee. How many different 5-person committees can…
A: It is given that Number of objects = 7Chosen objects = 5
Q: b) Use the cumulative relative frequency plot from part (a) to answer the following questions.…
A: The data for cumulative frequency is given as- Year survived Frequency0 to < 20.12 to< 40.524…
Q: A library subscribes to two different weekly news magazines, each of which is supposed to arrive in…
A: Given,Let the events be:W = WednesdayT = ThursedayF = FridayS = SaturdayThe corresponding…
Q: Please do not give solution in image format thanku The maximum wind speed in November can be…
A: In the given scenario, we are dealing with the classification of maximum wind speeds in November on…
Q: The test statistic of z= - 1.81 is obtained when testing the claim that p < 0.51. a. Using a…
A: Given thatThe test statistic (Z) = -1.81claim : p < 0.51Since the claim is defined less than thus…
Q: Height of students in statistics Fall 2004, Height in Inches 63 62 70 74 68 62 67 70 72 65 69 73 60…
A: 63, 62, 73, 69, 70, 72, 64, 62, 67, 60, 67, 64, 60, 67, 70, 70, 65, 65, 63, 67, 65, 74, 72, 69, 62,…
Q: The table below shows the weights of seven subjects before and after following a particular diet for…
A: The data for the weight of seven subjects before and after a particular diet is given.
Q: Homework 3: One Sample Tests and Stuff 1. Hypothesis: Reality TV watchers differ from the population…
A: It is given that:
Q: • Let X be exponential distributed with parameter 1. Determi the probability density function of y =…
A:
Q: 2. There are 13 members on the board of directors. a. If they must elect a chairman, a vice…
A: For no. of selected objects from available objects, with the assumption that the order of the…
Q: Suppose you want to estimate the effect of access to public transportation on house prices. You…
A: The data is defined below as follows:From the information, given the data is,Where,Price denotes the…
Q: Neighborhood Insurance sells fire insurance policies to local homeowners. The premium is $240, the…
A: As per our guidelines, we are supposed to answer only 3…
Q: Determine whether the given value is a statistic or a parameter. In a survey of 40 randomly selected…
A: The sample is any part of the population. The population is the whole set of observations used for…
Q: A newsgroup is interested in constructing a 90% confidence interval for the proportion of all…
A: sample size(n)=544x=442confidence level=90%
Q: Find the mean of the data summarized in the given frequency distribution. Compare the computed mean…
A: The measure of central tendency that represents the average value of the data is termed the 'mean'…
Q: 5. Basic Computation: Mean, Median, Mode Find the mean, median, and mode of the data set 8 27 26
A: 8,2,7,2,6
Q: The scores on an international business entrance have a mean of 480 and a standard deviation of 90.…
A: The mean of data is given as-The standard deviation of the data is given as-
please help, what is the variance?
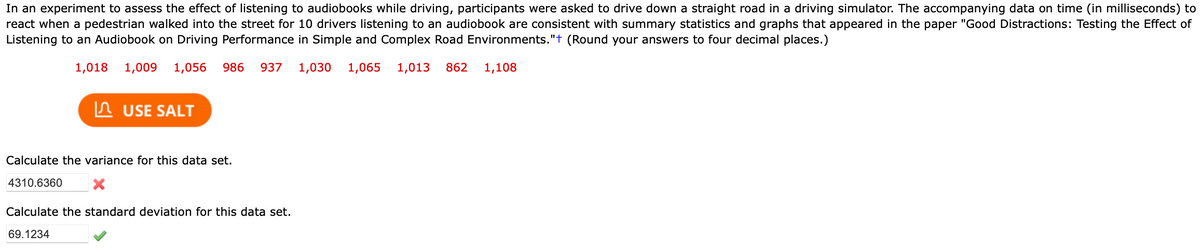
Step by step
Solved in 3 steps with 4 images
- What does the y -intercept on the graph of a logistic equation correspond to for a population modeled by that equation?In a test of braking performance, a tire manufacturer measured the stopping distance for one of its tire models. On a test track, a car made repeated stops from 100 kilometres per hour. The test was run on both dry and wet pavement, with the accompanying results.Dyslexia refers to a specific reading disability that affects 10% to 15% of the general population. A dyslexic child is defined as a child of normal or above-normal intelligence with no known organic behavioural disorders who, despite normal schooling, shows a reading lag of at least two years. A researcher proposed that dyslexia was the result of a complex visual deficit that could be immediately corrected by simply putting a blue plastic overlay on the reading material. To test this, 100 dyslexic children were randomly assigned to one of two groups, one of which read from pages with a clear plastic overlay and the other of which read from pages with a blue plastic overlay. The dependent variable was percentage correct on a multiple-choice reading comprehension test. a) Is this an observational study or an experiment? Explain your choice. b) Why did the researcher use a clear overlay as one of the treatment groups instead of just having the children read the passage without an…
- Dyslexia refers to a specific reading disability that affects 10% to 15% of the general population. A dyslexic child is defined as a child of normal or above-normal intelligence with no known organic behavioural disorders who, despite normal schooling, shows a reading lag of at least two years. A researcher proposed that dyslexia was the result of a complex visual deficit that could be immediately corrected by simply putting a blue plastic overlay on the reading material. To test this, 100 dyslexic children were randomly assigned to one of two groups, one of which read from pages with a clear plastic overlay and the other of which read from pages with a blue plastic overlay. The dependent variable was percentage correct on a multiple-choice reading comprehension test. What assumptions for the hypothesis test would need to be conducted for a one sample t test? Which data on spss would i need to look at for the assumptions?According to a newspaper study of more than 1 million medical dispatches from 2007 to 2012, the 911 response time for medical aid varies dramatically across a city. Under national standards adopted by the city's fire department, rescuers are supposed to arrive within six minutes to almost all medical emergencies. But the newspaper analysis found that in affluent hillside communities of the city, firefighters failed to hit that mark nearly 85% of the time. The following data show the response times, in minutes, for 10 emergency calls in the Griffith Park neighborhood. 11.8 10.3 10.7 10.6 11.5 8.3 10.5 10.9 10.7 11.2 Based on this sample of ten response times, compute the descriptive statistics (in minutes) in parts (a) and (b) and then answer the questions in parts (c) and (d). (a) mean, median, and mode (in min) mean minmedian minmode min (b) range and standard deviation (in min) (Round your answers to four decimal places.) range minstandard deviation min (c) Compute…Infants, even newborns, prefer to look at attractive faces compared to less attractive faces (Slater, et al., 1998). In the study, infants from 1 to 6 days old were shown two photographs of women’s faces. Previously, a group of adults had rated one of the faces as significantly more attractive than the other. The babies were positioned in front of a screen on which the photographs were presented. The pair of faces remained on the screen until the baby accumulated a total of 20 seconds of looking at one or the other. The number of seconds looking at the attractive face was recorded for each infant. Suppose that the study used a sample of n = 9 infants and the data produced an average of M = 13 for the attractive face with an estimated standard error sM= 1 (SS = 72). If there were no preference, the 20 seconds should be divided equally between the two photographs. Note that all the available information comes from the sample. Specifically, we do not know the population mean or the…
- Infants, even newborns, prefer to look at attractive faces compared to less attractive faces (Slater, et al., 1998). In the study, infants from 1 to 6 days old were shown two photographs of women’s faces. Previously, a group of adults had rated one of the faces as significantly more attractive than the other. The babies were positioned in front of a screen on which the photographs were presented. The pair of faces remained on the screen until the baby accumulated a total of 20 seconds of looking at one or the other. The number of seconds looking at the attractive face was recorded for each infant. Suppose that the study used a sample of n = 9 infants and the data produced an average of M = 13 for the attractive face with an estimated standard error sM= 1 (SS = 72). If there were no preference, the 20 seconds should be divided equally between the two photographs. Note that all the available information comes from the sample. Specifically, we do not know the population mean or the…In a recent survey, ice cream truck drivers in Cincinnati, Ohio, reported that they make about $280 in income on a typical summer day. The income was generally higher on days with longer work hours, particularly hot days, and on holidays. The accompanying data file includes five weeks of the driver’s daily income (Income), number of hours on the road (Hours), whether it was a particularly hot day (Hot = 1 if the high temperature was above 85°F, 0 otherwise), and whether it was a Holiday (Holiday = 1, 0 otherwise). Income Hours Hot Holiday 196 5 1 0 282 8 0 0 318 6 1 0 232 5 1 0 276 8 0 0 312 8 0 1 193 5 0 1 110 4 0 0 321 8 1 0 283 8 0 0 325 8 1 0 247 7 0 1 398 8 1 1 448 8 1 1 214 4 0 0 235 8 0 0 238 8 0 0 148 3 1 0 313 8 0 1 449 8 1 1 332 8 1 1 247 8 0 0 363 7 1 0 393 7 1 1 254 8 0 0 228 8 0 0 355 6 1 1 248 7 0 1 291 8 1 0 255 5 1 0 239 6 0 0 181 6 0 0 222 7 0 0 170 5 0 1 374 6 1 1 1. Estimate the effect of…A small university town has four local food restaurants that make deliveries. A group of marketing students were assigned to do a research project for their class assignment to compare how promptly the four restaurants deliver. On randomly chosen days, they order a chicken rice set from each restaurant, then record the elapsed time until the chicken rice set delivered to their college. Assume that their college is approximately the same distance from the four restaurants. The data are analysed using SPSS and the results are illustrated in Table 2a and 2b. question: Complete the ANOVA table (Table 2b) and calculate theF-ratio.
- A small university town has four local food restaurants that make deliveries. A group of marketing students were assigned to do a research project for their class assignment to compare how promptly the four restaurants deliver. On randomly chosen days, they order a chicken rice set from each restaurant, then record the elapsed time until the chicken rice set delivered to their college. Assume that their college is approximately the same distance from the four restaurants. The data are analysed using SPSS and the results are illustrated in Table 2a and 2b. question: At the 5% significance level, what can you conclude from the Levene's test result in Table 2a?In a recent survey, ice cream truck drivers in Cincinnati, Ohio, reported they make about $280 in income on a typical summer day. The income was generally higher on days with longer work hours, particularly hot day, and on holidays. The IceCream data file includes five weeks of the driver's daily income (Income), number of hours on the road (Hours), whether it was a particularly hot day (Hot = 1 if the high temperature was above 85-degrees F, 0 otherwise), and whether it was a Holiday (Holiday = 1, 0 otherwise). 1. Predict the income of a driver working 8 hours on a hot holiday. (Round to the nearest dollar.) 2. Predict the income of a driver working 8 hours on a hot day if it was not a holiday. (Round to the nearest dollar.)By what percentage is salary predicted to increase if ros increases by 50 points? Does ros have a practically large effect on salary?