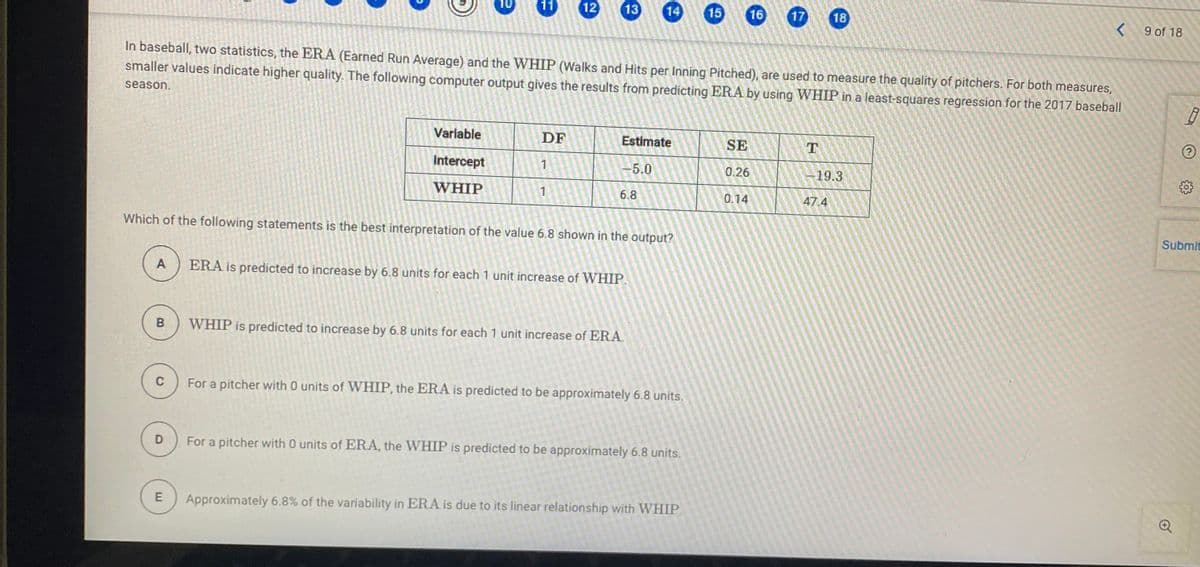
In baseball, two statistics, the ERA (Earned Run Average) and the WHIP (Walks and Hits per Inning Pitched), are used to measure the quality of pitchers. For both measures, smaller values indicate higher quality. The following computer output gives the results from predicting ERA by using WHIP in a least-squares regression for the 2017 baseball season. Variable DF Estimate SE T Intercept -5.0 0.26 -19.3 WHIP 1 6.8 0.14 47.4 Which of the following statements is the best interpretation of the value 6.8 shown in the output? A ERA is predicted to increase by 6.8 units for each 1 unit increase of WHIP. WHIP is predicted to increase by 6.8 units for each 1 unit increase of ERA For a pitcher with 0 units of WHIP, the ERA is predicted to be approximately 6.8 units. D For a pitcher with O units of ERA, the WHIP is predicted to be approximately 6.8 units. Approximately 6.8% of the variability in ERA is due to its linear relationship with WHIP.


Correlation
Correlation defines a relationship between two independent variables. It tells the degree to which variables move in relation to each other. When two sets of data are related to each other, there is a correlation between them.
Linear Correlation
A correlation is used to determine the relationships between numerical and categorical variables. In other words, it is an indicator of how things are connected to one another. The correlation analysis is the study of how variables are related.
Regression Analysis
Regression analysis is a statistical method in which it estimates the relationship between a dependent variable and one or more independent variable. In simple terms dependent variable is called as outcome variable and independent variable is called as predictors. Regression analysis is one of the methods to find the trends in data. The independent variable used in Regression analysis is named Predictor variable. It offers data of an associated dependent variable regarding a particular outcome.


Trending now
This is a popular solution!

Step by step
Solved in 2 steps


