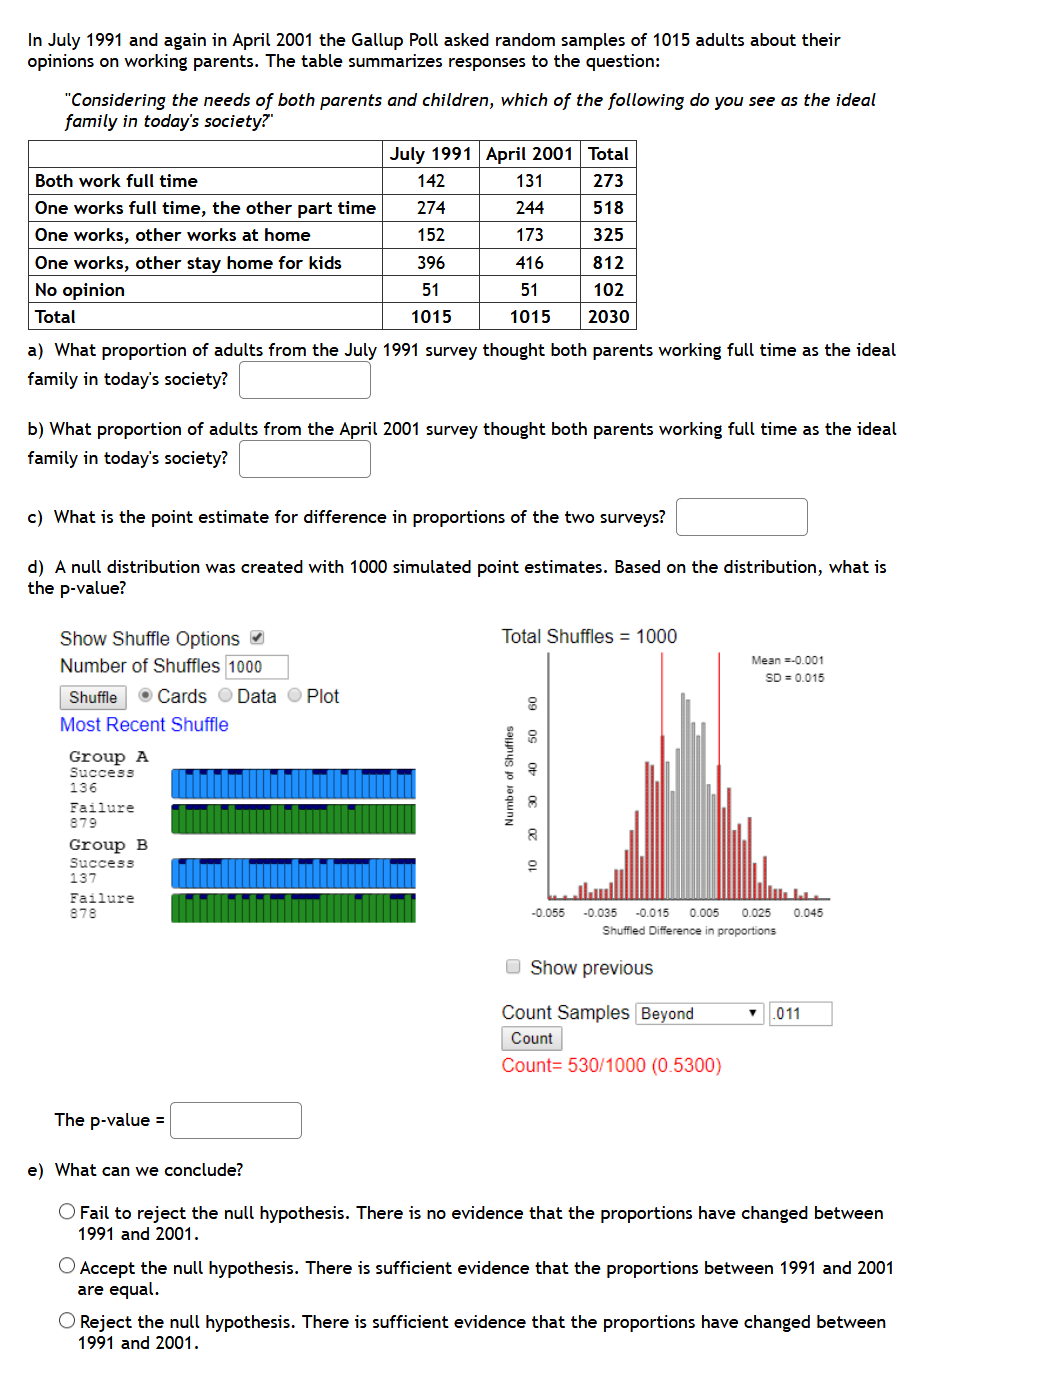
In July 1991 and again in April 2001 the Gallup Poll asked random samples of 1015 adults about their opinions on working parents. The table summarizes responses to the question: "Considering the needs of both parents and children, which of the following do you see as the ideal family in today's society?" July 1991 April 2001 Total Both work full time 142 131 273 One works full time, the other part time 274 244 518 One works, other works at home 152 173 325 One works, other stay home for kids 396 416 812 No opinion 51 51 102 Total 1015 1015 2030 a) What proportion of adults from the July 1991 survey thought both parents working full time as the ideal family in today's society? b) What proportion of adults from the April 2001 survey thought both parents working full time as the ideal family in today's society? c) What is the point estimate for difference in proportions of the two surveys?
In July 1991 and again in April 2001 the Gallup Poll asked random samples of 1015 adults about their opinions on working parents. The table summarizes responses to the question: "Considering the needs of both parents and children, which of the following do you see as the ideal family in today's society?" July 1991 April 2001 Total Both work full time 142 131 273 One works full time, the other part time 274 244 518 One works, other works at home 152 173 325 One works, other stay home for kids 396 416 812 No opinion 51 51 102 Total 1015 1015 2030 a) What proportion of adults from the July 1991 survey thought both parents working full time as the ideal family in today's society? b) What proportion of adults from the April 2001 survey thought both parents working full time as the ideal family in today's society? c) What is the point estimate for difference in proportions of the two surveys?

Holt Mcdougal Larson Pre-algebra: Student Edition 2012
1st Edition
ISBN:9780547587776
Author:HOLT MCDOUGAL
Publisher:HOLT MCDOUGAL
Chapter11: Data Analysis And Probability
Section: Chapter Questions
Problem 8CR

Related questions
Topic Video
Question
Transcribed Image Text:In July 1991 and again in April 2001 the Gallup Poll asked random samples of 1015 adults about their
opinions on working parents. The table summarizes responses to the question:
"Considering the needs of both parents and children, which of the following do you see as the ideal
family in today's society?
July 1991 April 2001 Total
Both work full time
142
131
273
One works full time, the other part time
274
244
518
One works, other works at home
152
173
325
One works, other stay home for kids
No opinion
396
416
812
51
51
102
Total
1015
1015
2030
a) What proportion of adults from the July 1991 survey thought both parents working full time as the ideal
family in today's society?
b) What proportion of adults from the April 2001 survey thought both parents working full time as the ideal
family in today's society?
c) What is the point estimate for difference in proportions of the two surveys?
d) A null distribution was created with 1000 simulated point estimates. Based on the distribution, what is
the p-value?
Show Shuffle Options
Total Shuffles = 1000
Mean =-0.001
Number of Shuffles 1000
SD = 0.015
Shuffle
O Cards O Data O Plot
Most Recent Shuffle
Group A
Success
136
Failure
879
Group B
Success
137
Failure
878
-0.055
-0.035
-0.015
0.005
0.025
0.045
Shuffled Difference in proportions
O Show previous
Count Samples Beyond
.011
Count
Count= 530/1000 (0.5300)
The p-value =
e) What can we conclude?
O Fail to reject the null hypothesis. There is no evidence that the proportions have changed between
1991 and 2001.
O Accept the null hypothesis. There is sufficient evidence that the proportions between 1991 and 2001
are equal.
O Reject the null hypothesis. There is sufficient evidence that the proportions have changed between
1991 and 2001.
Number of Shuffles
Expert Solution
Step 1
As per guidelines we will only answer first three subparts:
a)
Total number of adults from July 1991 survey = 1015
Number of adults from the July 1991 survey thought both parents working full time as ideal family in today's society = 142

Trending now
This is a popular solution!

Step by step
Solved in 3 steps

Knowledge Booster


Learn more about
Need a deep-dive on the concept behind this application? Look no further. Learn more about this topic, statistics and related others by exploring similar questions and additional content below.Recommended textbooks for you
Holt Mcdougal Larson Pre-algebra: Student Edition…
Algebra
ISBN:
9780547587776
Author:
HOLT MCDOUGAL
Publisher:
HOLT MCDOUGAL

Algebra & Trigonometry with Analytic Geometry
Algebra
ISBN:
9781133382119
Author:
Swokowski
Publisher:
Cengage
Holt Mcdougal Larson Pre-algebra: Student Edition…
Algebra
ISBN:
9780547587776
Author:
HOLT MCDOUGAL
Publisher:
HOLT MCDOUGAL
Algebra & Trigonometry with Analytic Geometry
Algebra
ISBN:
9781133382119
Author:
Swokowski
Publisher:
Cengage