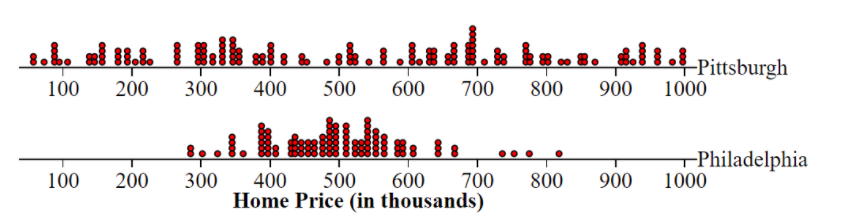
In order to compare the real estate markets in Pittsburgh and Philadelphia, a realtor selected a random sample of 150 homes in the Pittsburgh area and 100 homes in the Philadelphia area. Shown below are dotplots showing the distribution of home price for the homes in these two cities. The mean home price for both cities is approximately $500,000. The standard deviation of home price for one city is $100,740 and the other is $267,210. Which of the following gives the correct value and interpretation of the standard deviation of the home prices for homes in the Pittsburgh area? (A) The price of homes in the Pittsburgh sample are within $100,740 of the mean home price of $500,000. (B) In the sample of homes from Pittsburgh, most of the home prices are at least $100,740 above or below the mean home price of $500,000. (C) The price of the homes in the Pittsburgh sample typically vary by about $267,210 from the mean home price of $500,000. (D) In the sample of homes from Pittsburgh, the middle 50% of home prices are within $267,210 of the mean home price of $500,000. (E) The price of homes in the Pittsburgh sample are $100,740 from the mean home price of $500,000.


Inverse Normal Distribution
The method used for finding the corresponding z-critical value in a normal distribution using the known probability is said to be an inverse normal distribution. The inverse normal distribution is a continuous probability distribution with a family of two parameters.
Mean, Median, Mode
It is a descriptive summary of a data set. It can be defined by using some of the measures. The central tendencies do not provide information regarding individual data from the dataset. However, they give a summary of the data set. The central tendency or measure of central tendency is a central or typical value for a probability distribution.
Z-Scores
A z-score is a unit of measurement used in statistics to describe the position of a raw score in terms of its distance from the mean, measured with reference to standard deviation from the mean. Z-scores are useful in statistics because they allow comparison between two scores that belong to different normal distributions.
In order to compare the real estate markets in Pittsburgh and Philadelphia, a realtor selected a random sample of 150 homes in the Pittsburgh area and 100 homes in the Philadelphia area. Shown below are dotplots showing the distribution of home price for the homes in these two cities.
The mean home price for both cities is approximately $500,000. The standard deviation of home price for one city is $100,740 and the other is $267,210. Which of the following gives the correct value and interpretation of the standard deviation of the home prices for homes in the Pittsburgh area?
- (A) The price of homes in the Pittsburgh sample are within $100,740 of the mean home price of $500,000.
- (B) In the sample of homes from Pittsburgh, most of the home prices are at least $100,740 above or below the mean home price of $500,000.
- (C) The price of the homes in the Pittsburgh sample typically vary by about $267,210 from the mean home price of $500,000.
- (D) In the sample of homes from Pittsburgh, the middle 50% of home prices are within $267,210 of the mean home price of $500,000.
- (E) The price of homes in the Pittsburgh sample are $100,740 from the mean home price of $500,000.


Trending now
This is a popular solution!

Step by step
Solved in 2 steps


