In the diagram to the right, illustrating a per-unit tax equal to P, minus P3, tax and the excess burden of the tax revenue is represented by the areas S2 is represented by areas P2 B D 's E A C Quantity (millions per year) ..... Price (dollars per unit)


Q: and continue with the scenario of adding a $6 per unit tax. How much will BUYERS receive per unit…
A:
Q: The following graph represents the demand and supply for pinckneys (an imaginary product). The black…
A: Consumer surplus shows consumer ability to pay for any good and producer surplus shows producer’s…
Q: Question 2c - part 1 Given the following information Qo = 240 - 5P Qs = P where Qp is the quantity…
A: We have, Qd=240-5P & Qs=Pwe know at equilibrium,Qd=Qs240-5P=P240=6PP=40Also Qs=P=40 Let's put…
Q: QD = 240-5p QS = P Where QD is the quantity demanded, Qs is the quantity supplied and P is the…
A: Tax imposed on sellers would result in seller get less amount that what the buyer pays. The buyers…
Q: Suppose demand for good X is given by QD = 900- p/2 where p is the price and QD the quantity…
A: We are going to find the tax burden on consumer and producer to answer this question.
Q: Suppose demand is given by the equation Pp = 100 – 2Qp and supply is given by the equation PS = 50 +…
A: Equilibrium quantityPD=PS100-2Q=50+3Q100-50=3Q+2Q5Q=50Q=505Q=10
Q: Question 2c - part 1 Given the following information Qo = 240 - 5P %3D Qs = P %3D where Qp is the…
A: The equilibrium is found where the demand(dd) and supply(ss) cut each other. Graphically,
Q: Suppose that in the market for toys, the price of a toy is $24, the quantity sold is 96, the demand…
A: When a tax is introduced, the amount that is paid by consumers and producers of that tax is called…
Q: Its is known that the demand function for a product is P = 24 - 1/2Q and the supply function Q = 4 +…
A: Demand: P = 24 - 1/2Q Q = 4 + 2P P= Q/2-2 Equilibrium: Q=22 units, P= IDR13 The government provides…
Q: Suppose the market demand for milk is Qd = 40 – 4P Where Qd is millions of gallons demanded and P…
A:
Q: The demand and supply in a perfectly competitive market are QD = 60 - p and QS = 2p , respectively.…
A: QD=60-p and QS=2p In market equilibrium QD=QS so p=$20 and quantity =40 units
Q: Demand = 20-P; Supply = P/3; both linear. What is deadweight loss associated with a $4/unit output…
A:
Q: Consider a product that is fixed on supply QS=4 and the demand for the product is givenby QD= 10-2P.…
A: Elasticity of demand is the percentage change in quantity demanded due to a 1 percent change in…
Q: (Figure: Taxes and Deadweight Loss) In the diagram, the deadweight loss is ______ and government tax…
A: The correct answer to the above-mentioned question is C+E; B+D.
Q: By using only one graph, show and explain who bears the burden and excess burden of an excise…
A: As shown in diagram before tax the equilibrium price is determined by the intersection of supply and…
Q: Suppose the price elasticity of demand for luxury boats is zero. Explain, with the use of a diagram,…
A: Price elasticity: It refers to the change in the price of goods and services. The more change in…
Q: Suppose the demand for cigarettes is Q = 15 - 0.5Pand the supply of cigarettes is Q = P - 3, where P…
A: Equilibrium is achieved at the output level where Qs equals Qd
Q: The inverse demand function of chicken wings is p=50- 4g. The supply function of chicken wings is…
A: Given Demand function p = 50 - 4q -------(1) Supply function q = p ---------(2) At market…
Q: Case #1: Attached is a graph diagram depicting the market for soft drinks. If an excise tax equal to…
A: If $1 per liter excise tax on soft drinks imposed then consumers and sellers, buy or sell less of…
Q: Now calculate the government's tax revenue if it sets a tax of $0, $20, $40, $50, $60, $80, or $100…
A: tax Q TR 0 60 0 20 48 960 40 36 1440 60 24 1440 80 12…
Q: Case II: Attached is a graph diagram depicting the market for soft drinks. If an excise tax equal to…
A: Due to the imposition of excise tax of $1, the supply curve shifts upwards to S+Tax . The graph will…
Q: Case II: Attached is a graph diagram depicting the market for soft drinks. If an excise tax equal to…
A: This is a hand drawn diagram. So, there can be little discrepancies. The new equilibrium quantity of…
Q: 1. Suppose the demand for consumer goods is P=100-2Q. The supply of consumer goods is MC=20+0.5Q. a)…
A: P=100-2Q MC=20+0.5Q
Q: ANSWER E 2. The function of supply and demand for an item P = 14 - 2Q and P = 5 + 2Q. When against…
A: P = 14 - 2Q P = 5 + 2Q Equilibrium, demand = supply: 14 - 2Q = 5 + 2Q 4Q=9 Q=2.25 P = 9.5
Q: Using demand curve approach, explain how a commodity tax incurs excess burden
A: In a market, tax burden refers to the additional cost bear by the market participant when government…
Q: Title The supply and demand equations for a good are respectively. The government decides to impose…
A: Given: The supply and demand for an equation are: Qd = 500 - 9pQs = -100 + 6p Tax = t per unit of…
Q: Case II: Attached is a graph diagram depicting the market for soft drinks. If an excise tax equal to…
A: The following figure is given:
Q: The supply and demand curves for sugar are given by the following: P= 10+2Q (Supply) P=40-2Q…
A: Supply curve : P = 10+2Q Demand curve : P = 40-2Q At equilibrium, Demand = Supply 10+2Q = 40-2Q
Q: Given the demand and supply equations : P + 1/2QD = 10 3P - Qs = 17 a) Find the equilibrium…
A: As given Demand function is P = 10 - 0.5Qd and supply function is 3P - Qs = 17 》 P = (17+Qs)/3
Q: The figure below shows that the imposition of an indirect tax shifts the supply curve to the left.…
A: Tax Revenue is the revenue earned by the government by the impositional of taxes. TR=t*Q TR=Tax…
Q: Suppose that a city government introduces a $0.50 excise (commodity) tax on consumers of bottles of…
A: An excise tax is the tax levied on the production of goods. We proceed further according to the…
Q: Q2: Suppose the demand function is p = 50 - 2q………………1 and the supply function is p = 10 +…
A: Since you have posted multiple parts questions, we will solve the first one for you. If you want any…
Q: A $6 per unit tax is introduced into a market summarized by the demand and supply diagram below. The…
A: The equilibrium is established at price 7 $. With 6 $ tax per unit, the selling price will increase…
Q: Consider a market with the following demand and supply curves:…
A: Given: The demand curve for a market is: Qd = 20 - 2P The supply curve for a market is: Qs = -10 +…
Q: Show in four diagrams the incidence of an indirect (specific) tax in the case of elastic and…
A: Answer: Introduction: Incidence of tax: incidence of tax refers to the burden shared by producer and…
Q: Quantity Demanded: QD= 240-5P Quantity Supplied: QS= P Suppose the government decides to…
A: A tax is a monetary surcharge imposed by the government on the production or consumption of a good…
Q: suppose demand is given by q d(p)=1-p and supply q s(p)=p with prices in dollars.if buyers pay a 10…
A: Given information; Quantity demanded: qd(p)=1-p Quantity supplied: qs(p)=p Tax on buyer= 10 cent
Q: Refer to Figure 2. It shows the imposition of a per-unit tax on the market for cigarettes. S =…
A: New supply curve with tax increases the equilibrium price to PTAX. The new price consumer pays -…
Q: Suppose Luke values a scoop of Italian gelato at $4. Leia values a scoop of Italian gelato at $6.…
A: A tax is a unilateral payment made by the public to the government regarding many factors such as…
Q: The demand and supply equations for a product are: Qd = 300 - 6P and Qs = -40 + 6P. Determine the…
A: Market equilibrium is achieved at the point where the demand and supply curve intersects, i.e the…
Q: Given the following information: QD= 240-5P QS= P Where QD is the quantity demand, QS is the…
A: ANS Given; QD=240-5PQS=P At equilibrium QD = QS ∴240-5P=P⇒6P=240⇒P=2406=40 Putting P = 40 in the…
Q: Consider a product that is fixed on supply QS=4 and the demand for the product is given by QD=…
A: Elasticity of demand is the % change in quantity demanded due to 1% change in price. Elasticity of…
Q: suppose the government levles an excise tax of $3.00 per pack on cigarette buyers. Draw after-tax…
A: The taxes are the form of market regulations that drives a wedge between the price paid by the…
Q: Question 2d Given the following information Qp = 240 – 5P %3D Qs = P where Qp is the quantity…
A: Given - QD=240-5P, and QS=P, where QD and QS are demand and supply equations respectively.
Q: Fill in the following table with the quantity sold, the price buyers pay, and the price sellers…
A: Given: Tax=$20.30
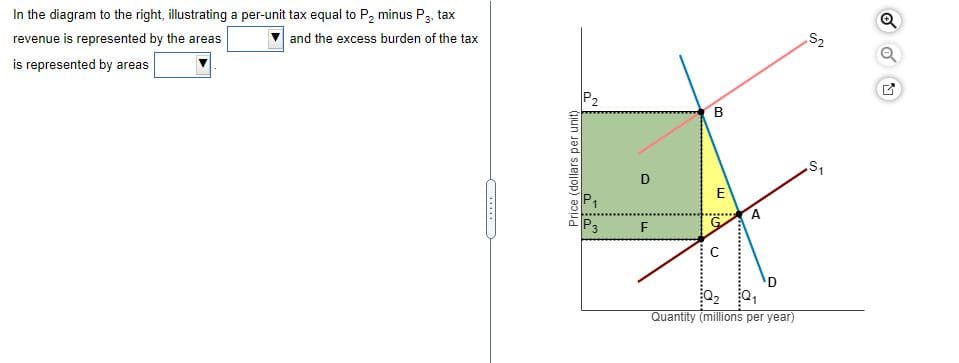
Q: In the diagram to the right, illustrating a per-unit tax equal to P, minus Pa, tax revenue is…
A: Tax revenue = D and F Excess burden = E and G


Trending now
This is a popular solution!

Step by step
Solved in 3 steps

- For the following calculations the tax threshold is $1,500,000 and the taxable income is taxed at 25%. Statutory deductions total 7.5% of the gross salary or wages.You work as a production manager at a food processing plant and earn a gross monthly salary of $345,000. i). Calculate your net monthly salary. ii). In addition to your salary you receive a $300, 000 Christmas bonus. Your friend Marie, the marketing manager with a salary close to yours, receives the same bonus. Do the work necessary to show that the net bonuses are $202,500. iii). You use all of your net bonus to buy a motorcycle which depreciates at 11% p.a. at the end of each year. Calculate the value of your motorcycle at the end of 3 years. iv). Marie invests her net bonus in a tax free retirement fund which pays 5.5% p.a. interest compounded monthly. Calculate the value of Marie’s investment at the end of 3 years.Need answers ASAP... 9. As an employee of a company, it is a must to pay tax to the government for its operation. This taxation burden is called: a. fixed tax b. property tax c. impact tax d. income taxMarginal tax rate in KS for single filter is T(I)= 3.1% $0 ≤ I ≤ 15,000 5.25% $15,000 ≤ I ≤ 30,000 5.7% I > 30,000 The standard deduction is $3,000 How much would someone who earns $13,000 a owe in state taxes?
- Aquatech Microsystems reported a TI of $80,000 last year. If the state income tax rate is 6%, determine the (a) average federal tax rate, (b) overall effective tax rate, (c) total taxes to be paid based on the effective tax rate, and (d) total taxes paid to the state and paid to the federal government.The Johnson’s had two children, both of them are married and now have their own families, call them Family A and Family B. They both file their U.S. income taxes as married, filing jointly. Information collected for a year for each family is shown below. Neglecting any effect of state taxes, use a spreadsheet and the latest tax rates from the IRS publication 17, Your Federal Income Tax (www.irs.gov), to determine the following for each family: (a) Percentage of TI paid in federal taxes. (b) Percentage of total income (salaries, dividends, and other) paid in federal taxes. Family A B Salaries, $1000 65 290 Dividends, $1000 8 58 Other income 0 14 Exemptions 5 3 Deductions, $1000 12 25 Exemptions are $4000 per individual (adult or child). Deductions for Family A are standard and itemized for B.Qd = 240 - 5p Qs = P Where Qd is the quantity demanded, Qs is the quantity supplied and P is the price. Suppose the government impose a tax of $12 per unit on sellers in the market. Determine; the tax revenue, deadweight loss and total after tax
- There are a variety of taxes that a person pays when buying an airline ticket. One tax is called the LUST fuel tax. LUST stands for leaking underground storage tank. The LUST tax is to establish a trust fund to provide money for oversight and corrective action against owners of leaking underground storage tanks and provides money for cleanup of LUST sites where the owner or operator is unknown. Is it efficient for customer’s of airlines to beforced to pay the tax?For tax year 2018 a married couple filing jointly has a taxable income of $120,000. How much do they owe in taxes? (do not include the $ in your answer)QD = 240 - 5P QS = P where QD is the quantity demanded, QS is the quantity supplied and P is the price. Suppose that the government decides to impose a tax of $12 per unit on sellers in this market. Determine: Producer suprlus after tax
- The per-unit tax on a good is the Select one: a. difference between the list price and the actual price paid by the buyer. b. licensing fees and other business taxes paid by sellers, averaged over the total quantity of goods sold. c. difference between wholesale and retail prices. d.difference between the total price paid by the buyer and the price received by the seller.What is the tax liability share for consuConsider the following tax system: Tax Brackets Marginal Tax Rates 1 0 – 50,000 10% 2 50,000 – 100,000 15% 3 100,000 – 150,000 18% 4 150,000 – 200,000 25% 5 200,000 – 250,000 30% 6 250,000 + 33% Assume that a business executive receives a gross monthly salary of $225,000. i) Calculate the average and marginal tax rates that he/she has to pay. ii) If the NIS, NHT and education tax amounts due at the end of November are $3,125.00, $5,600.08, and $5,040.35 respectively, what amount in net income (after-tax income) should the business executive expect to see on his pay stub. iii) Advise the Minister on the potential benefit of eliminating progressive taxation


