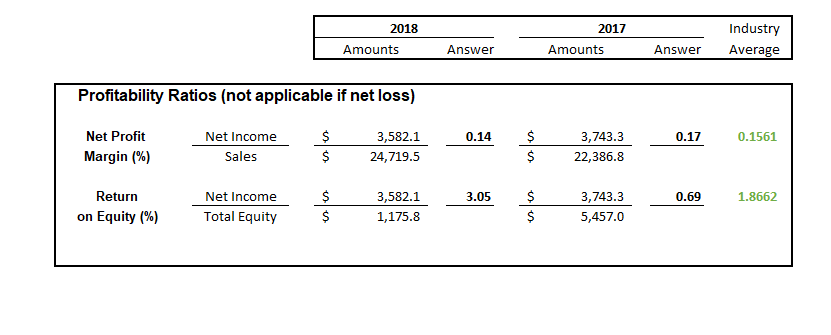
Industry 2018 2017 Amounts Answer Amounts Answer Average Profitability Ratios (not applicable if net loss) $ Net Profit 3,582.1 Net Income 0.14 3,743.3 0.17 0.1561 Margin (% $ $ Sales 22,386.8 24,719.5 Return Net Income 3,582.1 3.05 3,743.3 0.69 1.8662 Total Equity $ on Equity (%) 1,175.8 5,457.0


Q: Finance date of Adams Stores, Inc. for the year ending 2016 and 2017. Items 2016 2017 Sales…
A: A balance sheet is a representation of an individual's personal or corporation's financial balances…
Q: Calculating trend analysis Muscateer Corp. reported the following revenues and net income amounts:…
A: Trend analysis for revenue = Current year revenue / base year revenue
Q: The following are line items from the horizontal analysis of an income statemen
A: Wages expenses is the cause for concern, as wages expenses are increase by 25% over the year and it…
Q: Financial Ratios for 2018 Current Ratio Quick ratio Receivable Turnover Inventory Turnover Debt…
A: The financial ratios are important elements of the ratio analysis. The ratio analysis helps in the…
Q: Current Assets - 2015 - $316 2016 - $450 Net Fixed Assets - 2015 $1260…
A: A balance sheet is the statement of the financial position which shows the balance of assets,…
Q: Questions: Selected comparative statement data for Rawan Products Company. All balance sheet data…
A: A balance sheet is a financial statement that shows the assets, liabilities, and shareholder equity…
Q: Computing and Interpreting Financial Statement Ratios Following are selected ratios of Norfolk…
A: Ratio analysis means where different ratio of various years of years companies has been compared and…
Q: 2018 calculate: Net profit margin Gross profit margin Current ratio
A: Hi student Since there are multiple subparts, we will answer only first three subparts.
Q: Only the Market Value Ratio. Lan & Chen Technologies: Income Statements for Year Ending…
A: Market Value Ratio are those ratios that helps in deciding whether market price of share is…
Q: 2018 2017 d. Inventory turnover e. Gross profit percentage f. Debt to equity…
A: Answer - d) Inventory turnover ratio: Inventory Turnover Ratio : Cost of Goods Sold / Average…
Q: Comment on the changes between these two years. How do the changes in current ratios between 2017…
A: The current ratio is the measurement of short-term ability to meet the firm’s short-term…
Q: Short-Term Notes Payable 300 Retained Earnings 2377 Sales Revenue 19385 SG&A Expense 2600 2018 Tax…
A: Income statement shows profit earned or loss incurred by a corporation during an accounting year.
Q: Comment on the changes between these two years. How do the changes in profit margin between 2017…
A: Profit Margin:It is one of the profitability ratios that helps a company to measure how many…
Q: Financial Ratios for 2018 Current Ratio Quick ratio Receivable Turnover Inventory Turnover Debt…
A: The question is related to Ratio Analysis. The details of ratios are given in respect of P & P…
Q: Define current ratio and quick ratio. Discuss what the liquidity ratios reveal about the company…
A: Current ratio: Current ratio is used to determine the relationship between current assets and…
Q: BALANCE SHEET Tenaga National Berhad Inc. Income Statement (in million except per share data, and as…
A: The question is related to the Ratio Analysis. The details are given. Inventory Turnover Ratio =…
Q: Financial statement data for years ending December 31 for Latchkey Company OBJ.S A 288 PE 6-7A Ratio…
A: The ratio of sales to assets indicates the ability of the business organization to generate sales…
Q: Selected balance sheet and income statement information from Easton's, Inc. follows ($ millions).…
A: Given information: Net income for the year 2017 $834 Stockholders' Equity 2016 $4,115…
Q: Discuss what the leverage ratios reveal about Starbucks financial health, including any description…
A: Leverage ratio is a financial performance measure. It depicts the amount which has been raised by…
Q: ounts payable turnover and days' payable outstanding (DPO) for 2017 and 2018. tio 20400 Data Table…
A: Ratio analysis is a method of measuring the financial position of the organization with different…
Q: What are the firm's current ratios for 2018 and 2019? Income Statements ($ in millions) Balance…
A: Current ratio provides information as to what is the percentage of current assets over current…
Q: Discuss what the liquidity ratios reveal about Starbucks financial health, including any description…
A: As per the given information, the current ratio and quick ratio of the firm SB increased in 2018…
Q: Comprehensive Income December 31, 2017 and 2018 2017 4,551,000 Increase/Decrease Peso Percent 2018…
A: Horizonal Analysis Horizontal analysis is one of the method to use to measure the financial strength…
Q: Calculation and interpretation of ratios. Data for White Star Limited: Net operating profit after…
A: Accounting ratios are those ratios which states the two lines of the financial statement of the…
Q: (Comprehensive Income) Roxanne Carter Corporation reported the following for 2017: net sales…
A: a.
Q: Assume the following sales data for a company: 2018 $980,000 2017 875,000 2016 700,000 If 2016 is…
A: The increase in sales is calculated as sales increase in current year divided by sales in base year.
Q: Compute ROE Selected balance sheet and income statement information for Home Depot follows. S…
A: Lets understand the basics. Return on equity means a net income generated through using the equity…
Q: I need assistance in finding the ratios for the following (see attached sheets). Calculate the…
A: 2016: Working note: Calculation of quick assets: Calculation of…
Q: Financial Ratios for 2018 Current Ratio Quick ratio Recelvable Turnover Inventory Turnover Debt…
A: Ratio Analysis is one of the various tools for analyzing the financial statement. A single ratio in…
Q: Gross profit Required: Calculate the following ratios for 2014 and 2015. When data limitations…
A: Based on the financial statements given various ratios are to be calculated for both the years.…
Q: INCOME STATEMENT OF QUICK BURGER CORP., 2016 (Figures in $ millions) $ 27,587 17,589 1,422 $ 8,576…
A: Free cash flows are the amount of cash from operations after incurring capital expenditures. It is…
Q: Compute and Interpret Ratios Selected balance sheet and income statement information from Illinois…
A: a. Return on Net Operating Assets (RNOA) = Net operating profit after taxAverage net operating…
Q: COMPANY A RATIO 2019 2018 Liquidity 1 Current Ratio 2 Quick Ratio Profitability 3 ROE 4 ROA 0.67…
A: Ratio analysis is the analysis in which ratios are compared for different periods and companies.
Q: a. Compute profitability measures RNOA and ROE for 2018 and 2017. In which year are the measures…
A: RNOA: Return on net operating assets reveals the return made by the business from the revenues. It…
Q: Selected current year company information follows: Net income Net sales Total liabilities,…
A: Correct option is D. 6.28% Return on Asset's (ROA) : = Earning after tax / Total assets × 100
Q: Financial statement data for years ending December 31 for Latchkey Company follows: 2016 2015 Sales…
A: The sales to asset ratio are calculated by dividing the total sales of the entity by the average…
Q: Comment on the changes between these two years. What do the changes in ROA mean?
A: The amount of returns which is calculated by the company by dividing the annual net income that is…
Q: Ben Merchandise presented the following balances for 2017 and 2016: 2017 2016 P853,500 (net sales)…
A: Formula: Gross profit = Sales - Cost of goods sold Gross profit ratio = Gross profit Sales Percent…
Q: What do these ratios say about a company it an automobile industry?
A: Financial ratios:Financial ratios can be defined as the comparison made between the different items…
Q: Compute for the Current ratio for 2017, Interest Coverage ratio, Profit margin or Return on Sales…
A: Current ratio for 2017 Current Assets/ Current Liabilities 2588000/640000 4.04
Q: Financial Ratios for 2018 Current Ratio Quick ratio Receivable Turnover Inventory Turnover Debt…
A: Gross Profit Margin: Gross Profit Margin is expressed as Gross Profit as a percentage of Sales.…
Q: Perform vertical analysis forlvanhoeClothiers. (Round percentages to 1 decimal place, e.g. 12.1%.)…
A: The horizontal analysis is performed to compare the financial results of two different years. The…
Q: 2015-2019 Financial Statement Data and Stock Price Data for Mydeco Corp. (All data as of fiscal year…
A: Revenue: Revenue is the amount earned by the company by selling the goods or providing the services…
Q: Filling in the missing values
A: Step1: Calculating the value of account payable for the year 2017. We have,Free Cash Flow = Earnings…
Q: Comment on the changes between these two years. What do the changes in ROE mean? What does such a…
A: Return on equity (ROE) is the measure of financial performance, which is calculated by dividing the…
Discuss what the profitablility ratios reveal about Starbucks financial health, including any description of trend analysis, benchmarks, standard measurements or other types of analysis used once the ratio amount is known.
Profitability ratios are used by investors and analyst to analyze the ability of a business to generate profits from its operations. These ratios help in measuring how well a company earn profit from its operations.

Step by step
Solved in 2 steps


- Selected ratios formulars Unilever 2021 BOPP 2021 ROCE PBIT / net assets * 100 (32,424/39,406 *100 = - 82% 102,154 / 192,758 *100 =53% Net Assets Turnover Revenue / Net Assets 526,912 / 39,406 = 13 times 214,174 / 192,758 = 1 time Gross Profit Margin Gross profit / revenue *100 97,046 / 526,912 *100 18.4% 115,462 / 214,174 * 100 54% Net Profit Before Tax PBT / revenue * 100 (35,005) / 526,912* 100 = -6.6% 104,778 / 214,174* 100 =48.9% Current Ratio Current assets / current liabilities 214,665/341,171 = 0.5 139,104 / 30,368 = 4.5 Quick Ratio Current assets – inventory / current liabilities 214,665-91,627 /341,171 = 0.4 139,104 -13,248/ 30,368 = 4.1 Inventory Days Inventory / cost of sales * 365 days 91,627/ 429,866 *365 = 77 days 13,248 / 101,397 *365 = 47 days Receivable Days Receivables / cost of sales * 365 days 24,515 / 429,866 *365 =20 days 92,860 / 101,397 *365 =334 days Payable Days…performance of National Company. Comment on overall financial position and financial health of the business. Identify problems and recommend possible solutions, if historical ratios of company are: Ratios201720182019 Current Ratio1.41.51.6 Acid Test Ratio0.850.740.63 Asset Turnover Ratio4 times3.22.5 Inventory Turnover Ratio6 times5.55 Collection Period6 times5.55 Account payable turnover8 times10 times12 times Total Debt to equity Ratio1.381.611.91 Interest cover543.5 Gross Profit Ratio20%22%23% Net Profit Margin8.5%6.7%3.8% Return on Equity20%21%24% Sales Growth Rate8%5%2% P/E Ratio1098 Fixed Asset Utilization Ratio21.71.4Calculate return on assets and profit margin.LO9 The following information is available for Ware Ltd for 2018: sales revenue $7 840 000; cost of sales $3 528 000; profit $1 176 000; total equity $2 233 300; average total assets $5 113 000. Calculate the return on assets and profit margin for Ware Ltd for 2018.
- Solvency and Profitability Trend Analysis Addai Company has provided the following comparative information: 20Y8 20Y7 20Y6 20Y5 20Y4 Net income $1,078,700 $929,900 $781,400 $667,900 $566,000 Interest expense 366,800 334,800 289,100 220,400 175,500 Income tax expense 345,184 260,372 218,792 173,654 135,840 Total assets (ending balance) 8,226,651 8,779,231 6,276,721 6,620,869 5,020,826 Total stockholders' equity (ending balance) 2,543,681 3,148,667 2,003,133 2,553,135 1,531,881 Average total assets 8,502,941 7,527,976 6,448,795 5,517,391 4,722,930 Average stockholders' equity 2,846,174 2,575,900 2,278,134 2,042,508 1,808,307 You have been asked to evaluate the historical performance of the company over the last five years. Selected industry ratios have remained relatively steady at the following levels for the last five years:…Solvency and Profitability Trend Analysis Addai Company has provided the following comparative information: 20Y8 20Y7 20Y6 20Y5 20Y4 Net income $1,078,700 $929,900 $781,400 $667,900 $566,000 Interest expense 366,800 334,800 289,100 220,400 175,500 Income tax expense 345,184 260,372 218,792 173,654 135,840 Total assets (ending balance) 8,226,651 8,779,231 6,276,721 6,620,869 5,020,826 Total stockholders' equity (ending balance) 2,543,681 3,148,667 2,003,133 2,553,135 1,531,881 Average total assets 8,502,941 7,527,976 6,448,795 5,517,391 4,722,930 Average stockholders' equity 2,846,174 2,575,900 2,278,134 2,042,508 1,808,307 You have been asked to evaluate the historical performance of the company over the last five years. Selected industry ratios have remained relatively steady at the following levels for the last five years:…Solvency and Profitability Trend Analysis Addai Company has provided the following comparative information: 20Y8 20Y7 20Y6 20Y5 20Y4 Net income $273,406 $367,976 $631,176 $884,000 $800,000 Interest expense 616,047 572,003 528,165 495,000 440,000 Income tax expense 31,749 53,560 106,720 160,000 200,000 Total assets (ending balance) 4,417,178 4,124,350 3,732,443 3,338,500 2,750,000 Total stockholders’ equity (ending balance) 3,706,557 3,433,152 3,065,176 2,434,000 1,550,000 Average total assets 4,270,764 3,928,396 3,535,472 3,044,250 2,475,000 Average total stockholders' equity 3,569,855 3,249,164 2,749,588 1,992,000 1,150,000 You have been asked to evaluate the historical performance of the company over the last five years. Selected industry ratios have remained relatively steady at the following levels for the last five years: 20Y4–20Y8 Return on total assets 28%…
- Solvency and Profitability Trend Analysis Addai Company has provided the following comparative information: 20Y8 20Y7 20Y6 20Y5 20Y4 Net income $273,406 $367,976 $631,176 $884,000 $800,000 Interest expense 616,047 572,003 528,165 495,000 440,000 Income tax expense 31,749 53,560 106,720 160,000 200,000 Total assets (ending balance) 4,417,178 4,124,350 3,732,443 3,338,500 2,750,000 Total stockholders’ equity (ending balance) 3,706,557 3,433,152 3,065,176 2,434,000 1,550,000 Average total assets 4,270,764 3,928,396 3,535,472 3,044,250 2,475,000 Average total stockholders' equity 3,569,855 3,249,164 2,749,588 1,992,000 1,150,000 You have been asked to evaluate the historical performance of the company over the last five years. Selected industry ratios have remained relatively steady at the following levels for the last five years: 20Y4–20Y8 Return on total assets 28%…Solvency and Profitability Trend Analysis Addai Company has provided the following comparative information: 20Y8 20Y7 20Y6 20Y5 20Y4 Net income $273,406 $367,976 $631,176 $884,000 $800,000 Interest expense 616,047 572,003 528,165 495,000 440,000 Income tax expense 31,749 53,560 106,720 160,000 200,000 Total assets (ending balance) 4,417,178 4,124,350 3,732,443 3,338,500 2,750,000 Total stockholders’ equity (ending balance) 3,706,557 3,433,152 3,065,176 2,434,000 1,550,000 Average total assets 4,270,764 3,928,396 3,535,472 3,044,250 2,475,000 Average total stockholders' equity 3,569,855 3,249,164 2,749,588 1,992,000 1,150,000 You have been asked to evaluate the historical performance of the company over the last five years. Selected industry ratios have remained relatively steady at the following levels for the last five years: 20Y4–20Y8 Return on total assets 28%…Adams Inc. has the following data: rRF = 4.00%; RPM = 7.00%; and b = 1.20. What is the firm's cost of common from retained earnings based on the CAPM? Group of answer choices 11.53% 12.40% 12.03% 11.78% 12.65%
- Solvency and Profitability Trend Analysis Crosby Company has provided the following comparative information: 20Y8 20Y7 20Y6 20Y5 20Y4 Net income $5,571,720 $3,714,480 $2,772,000 $1,848,000 $1,400,000 Interest expense 1,052,060 891,576 768,600 610,000 500,000 Income tax expense 1,225,572 845,222 640,320 441,600 320,000 Total assets (ending balance) 29,378,491 22,598,839 17,120,333 12,588,480 10,152,000 Total stockholders’ equity (ending balance) 18,706,200 13,134,480 9,420,000 6,648,000 4,800,000 Average total assets 25,988,665 19,859,586 14,854,406 11,370,240 8,676,000 Average total stockholders' equity 15,920,340 11,277,240 8,034,000 5,724,000 4,100,000 You have been asked to evaluate the historical performance of the company over the last five years. Selected industry ratios have remained relatively steady at the following levels for the last five years: 20Y4–20Y8…What is the comparison (analysis) of the P/E Ratio of Industry Average Ratio and the Company A Ratio? The P/E Ratio has decreased and increased. Why? Industry Average, P/E RATIO 2015: 16.92x 2016: 8.29x 2017: 12.04x 2018: 10.38x 2019: 3.09x Company A, P/E RATIO 2015: 0.20x 2016: 0.32x 2017: 0.17x 2018: 0.11x 2019: 0.15xChoose the correct letter of answer and provide a solution. Thanks The financial ratios of a firm are as follows: Current Ratio=1.33; Acid-test ratio=0.80; Current liabilities=P40,000.00; Inventory turnover ratio=6 times. What is the sales/cost of good sold of the firm? *a. P57,200.00b. P77,200.00c. P97,20000d. P117,200.00e. P127,200.00