ing the values given in the table.- 3 AB,4) y= g() 3+ 2,3) 2+ A(1,2) (4,2) (3, 1) (2, 1) +%+ + 1 2 3 ) -3 -2/-1 4,-1)/-1+ 4 5x (4,-1) m(3,-2) -2+ 190801 (4,-3) y= fe) -3+ -4+ In B) 0


Q: 19. Let x = percent return for an investment in stock 1 and y = percent return for an investment in…
A:
Q: Which one of the following is an example of discrete variable? a. Colors of various cars in a…
A: A discrete variable can only take on a certain number of values.
Q: c) The Coefficient of Variation (C.V) for the following data (11, :51, 12, 25, 10, 25, 13) is
A: Co-efficient of variation = σμ*100
Q: c. The correlation coefficient remains unchanged under each of the following operations: Multiplying…
A: Given problem Given that c) The correlation coefficient remains unchanged under each of the…
Q: Events X and Y are such that ?(X)= 0.35 and ?(X ∪ ?) = 0.80. Given that X and Y are independent and…
A: It is given that P(X) =0.35, P(X∪Y) = 0.80.
Q: i. The equations of an ARCH-in-mean model are shown below: y, = B, +0h, + e, e|I1- N(0, h) h = 8+a,e…
A:
Q: Sales of a company (in $100,000) for the last 7 years are listed in the following table. Use the…
A: Let Q1=1, if the quarter is 10, otherwise Q2=1, if the quarter is 20, otherwise Q3=1, if the quarter…
Q: Percentiles a) Consider a set of (n=25) ordered data points x1, x2, ..., x24, x25. Find…
A: a) The given number of data points are x1, x2, x3, …, x24 and x25.
Q: What is the student's GPA for that term? Round to two decimal places.
A: Given data, Subject No of Credits Grade Maths 5 4 Music 3 2 Chemistry 5 2.9 Journalism 5…
Q: Which one of the following is an example of a discrete variable? a. Number of Burgers sold by KFC b.…
A: It is been asked to identify the correct example for discrete variable from given options
Q: To compute a student's Grade Point Average (GPA) for a term, the student's grades for each course…
A:
Q: The scatterplot in the figure shows the relationship between the countries animal for capital income…
A: 13. The variable X represents the per capital income and variable Y represents the percentage of…
Q: % of women in the U.S. are either shorter than 5 ft. or taller than 6 ft?
A: Frequency table is a method of arranging raw data into categories and recording their frequencies.
Q: To compute a student's Grade Point Average (GPA) for a term, the student's grades for each course…
A: Given that, The student's grades for each course are weighted by the number of credits for the…
Q: Arm circumferences (cm) and heights (cm) are measured from randomly selected adult females. The 148…
A: Given Data: Regression equation: y^=159+0.1111x
Q: STUDENT Q1 1 1 2 3 4 5 6 7 8 9 10 11 12 13 14 15 16 17 18 19 20 21 22 23 0 1 1 1 1 1 1 0 1 0 1 1 1 1…
A: Given Information: Consider the given data: Student Q1 Q2 Q3 Q4 Q5 Q6 Q7 Q8 Q9 Q10 Q11 Q12 Q13…
Q: Events X and Y are such that ??(??) = 0.30 and ??(?? ∪ ??) = 0.75. Given that X and Y are…
A: Given X and Y are independent P(X)=0.30, P(XUY)=0.75 P(Y)= ?
Q: By how many times does the sample size have to be increased to decrease the margin of error by a…
A: To determine, by how many times does the sample size have to be increased to decrease the margin of…
Q: 4. A distribution of the scores of a group of students who took a Mathemat shown helow. Determine…
A: Given frequency table: Class Frequency (f) 75 - 79 2 70 - 74 5 65 - 69 8 60 - 64 15 55…
Q: Number of alcoholic drinks per week (i.e., drinking) and GPA have r = -0.69, which of the following…
A: When the y variable tends to decrease as the x variable increases, it can be said that there is a…
Q: ALUATION when she gets more sleep she does better on tests. To test her hypothesis, she tracked how…
A:
Q: Arm circumferences (cm) and heights (cm) are measured from randomly selected adult females. The…
A: Given, The linear regression equation is, The objective is to find the best predicted value…
Q: Problem: In an examination at which 600 candidates appeared, boys outnumbered girls by 16% of all…
A:
Q: 3) | company offers to customes who have insured a vehicle with the company are shown for various…
A: Solution-: Let, X=Years, Y=Discount (%) We want to (a) Construct a scatter diagram for the given…
Q: (CLO-1) The number of mobile social media users in UAE in 2019 increased by 1.1% and in 2020…
A:
Q: To compute a student's Grade Point Average (GPA) for a term, the student's grades for each course…
A: The weighted average is defined as, X¯=∑i=1nXi wi∑i=1nwi,n is the sample size,Xi is the ith…
Q: A book company sold a total of 70,000 books. The company's yearly sales are given in the histogram.…
A:
Q: generating functions, Mx, (t) = e²¹², Mx₂(t) = e²t + 3t², and Mx₂(t) = (-¹2) ². 1-2t, c) Find the…
A:
Q: 25. Coefficient of correlation lies between: a. 0 and +1 b. -3 and +3 c. 0 and –1 d. –1 and +1
A: Correlation: the relation ship (or) an association between two or more variables is called…
Q: MY NOTES The table shows the performance of a selection of 117 stocks after one year. (Take S to be…
A:
Q: An agricultural field trial compares the yield of two varieties of corn. The researchers divide in…
A: a) Assume that µd is the true mean difference of yield for variety A and Variety B. That, is µd =…
Q: The table shows the performance of a selection of 98 stocks after one year. (Take S to be the set of…
A:
Q: To compute a student's Grade Point Average (GPA) for a term, the student's grades for each course…
A: Introduction: Suppose for a student, the ith course had ci credit hours, and the student obtains a…
Q: Relative Strength Relative Strength Percentage Last Week This Week of Weeks Stocks stronger Stocks…
A: For each Relative strength, the total percentage is equal to 100. And the probability for each…
Q: 9 of the students are girls. What 3. There are 50 students in a class, both boys and girls. percent…
A: It is given that Number of girls = 9 Total number of students = 50 Number of boys = 50 - 9 = 41
Q: Q5. (i) Prices of chocolates each (OMR.): 0.10, 0.19, 0.11, 0.19, 0.17, 0.12, 0.12, 0.12, 0.10,…
A: A frequency distribution is a representation, either in a graphical or tabular format.It…
Q: An agricultural field trial compares the yield of two varieties of corn. The researchers divide in…
A: Given data x̄ = 3.2 Standard deviation s = 4.63 Sample size n = 20 a) Null Hypothesis: H0: µD = 0…
Q: Healthy Eating Americans appear to be eating healthier. Between 1970 and 2007 the per capita…
A: For the given data Perform Anova single factor
Q: Literacy Rates For the same countries used in Exer- cise 22, the literacy rates (in percents) for…
A: The least square regression equation is obtained using EXCEL: Select Data > Data analysis >…
Q: Caffeine A student study of the effects of caffeine asked volunteers to take a memory test 2 hours…
A:
Q: Risk and Returns. Windsor stock has produced returns of 22.6 percent, 18.7 percent, 15.7 percent,…
A: Given Information : Risk and Returns. Windsor stock has produced returns of 22.6 percent, 18.7…
Q: Miss Henderson had this table of values on the board. What relation represents the data in this…
A: You have to write the table values in coordinate form. So, we have…
Q: Arm circumferences (cm) and heights (cm) are measured from randomly selected adult females. The 143…
A:
Q: At the Olympic level of competition, even the smallest factors can make a difference between winning…
A: Use the given data to form the excel table: Shooter During Heartbeats Between Heartbeats d…
Q: 7. The table below shows the amount of change in rainfall in some Texas counties between the months…
A: We are given the following data.
Q: Which of the following statement is true? a. If the value of the coefficient of determination is…
A: The coefficient of determination is the squared value of the correlation coefficient. In the…
Q: Nuts and Bolts. A hardware manufacturer produces nuts and bolts. Each bolt produced is attached to a…
A: a)
Q: A researcher wants to know if male and female college students differ with regard to their GPAs. She…
A:
Q: Data Set: {(-3, 4), (-2, 3), (–1,3), (0, 7), (1, 5), (2, 6), (3, 1)} 1. The regression line is: y =…
A: Given that : Given data are{(-3,4),(-2,3), (-1,3),(0,7),(1,5),(2,6),(3,1)}
Q: CORRELATIONS 1-R1232 = (1 – r12²)(1 – r13,2²)
A:
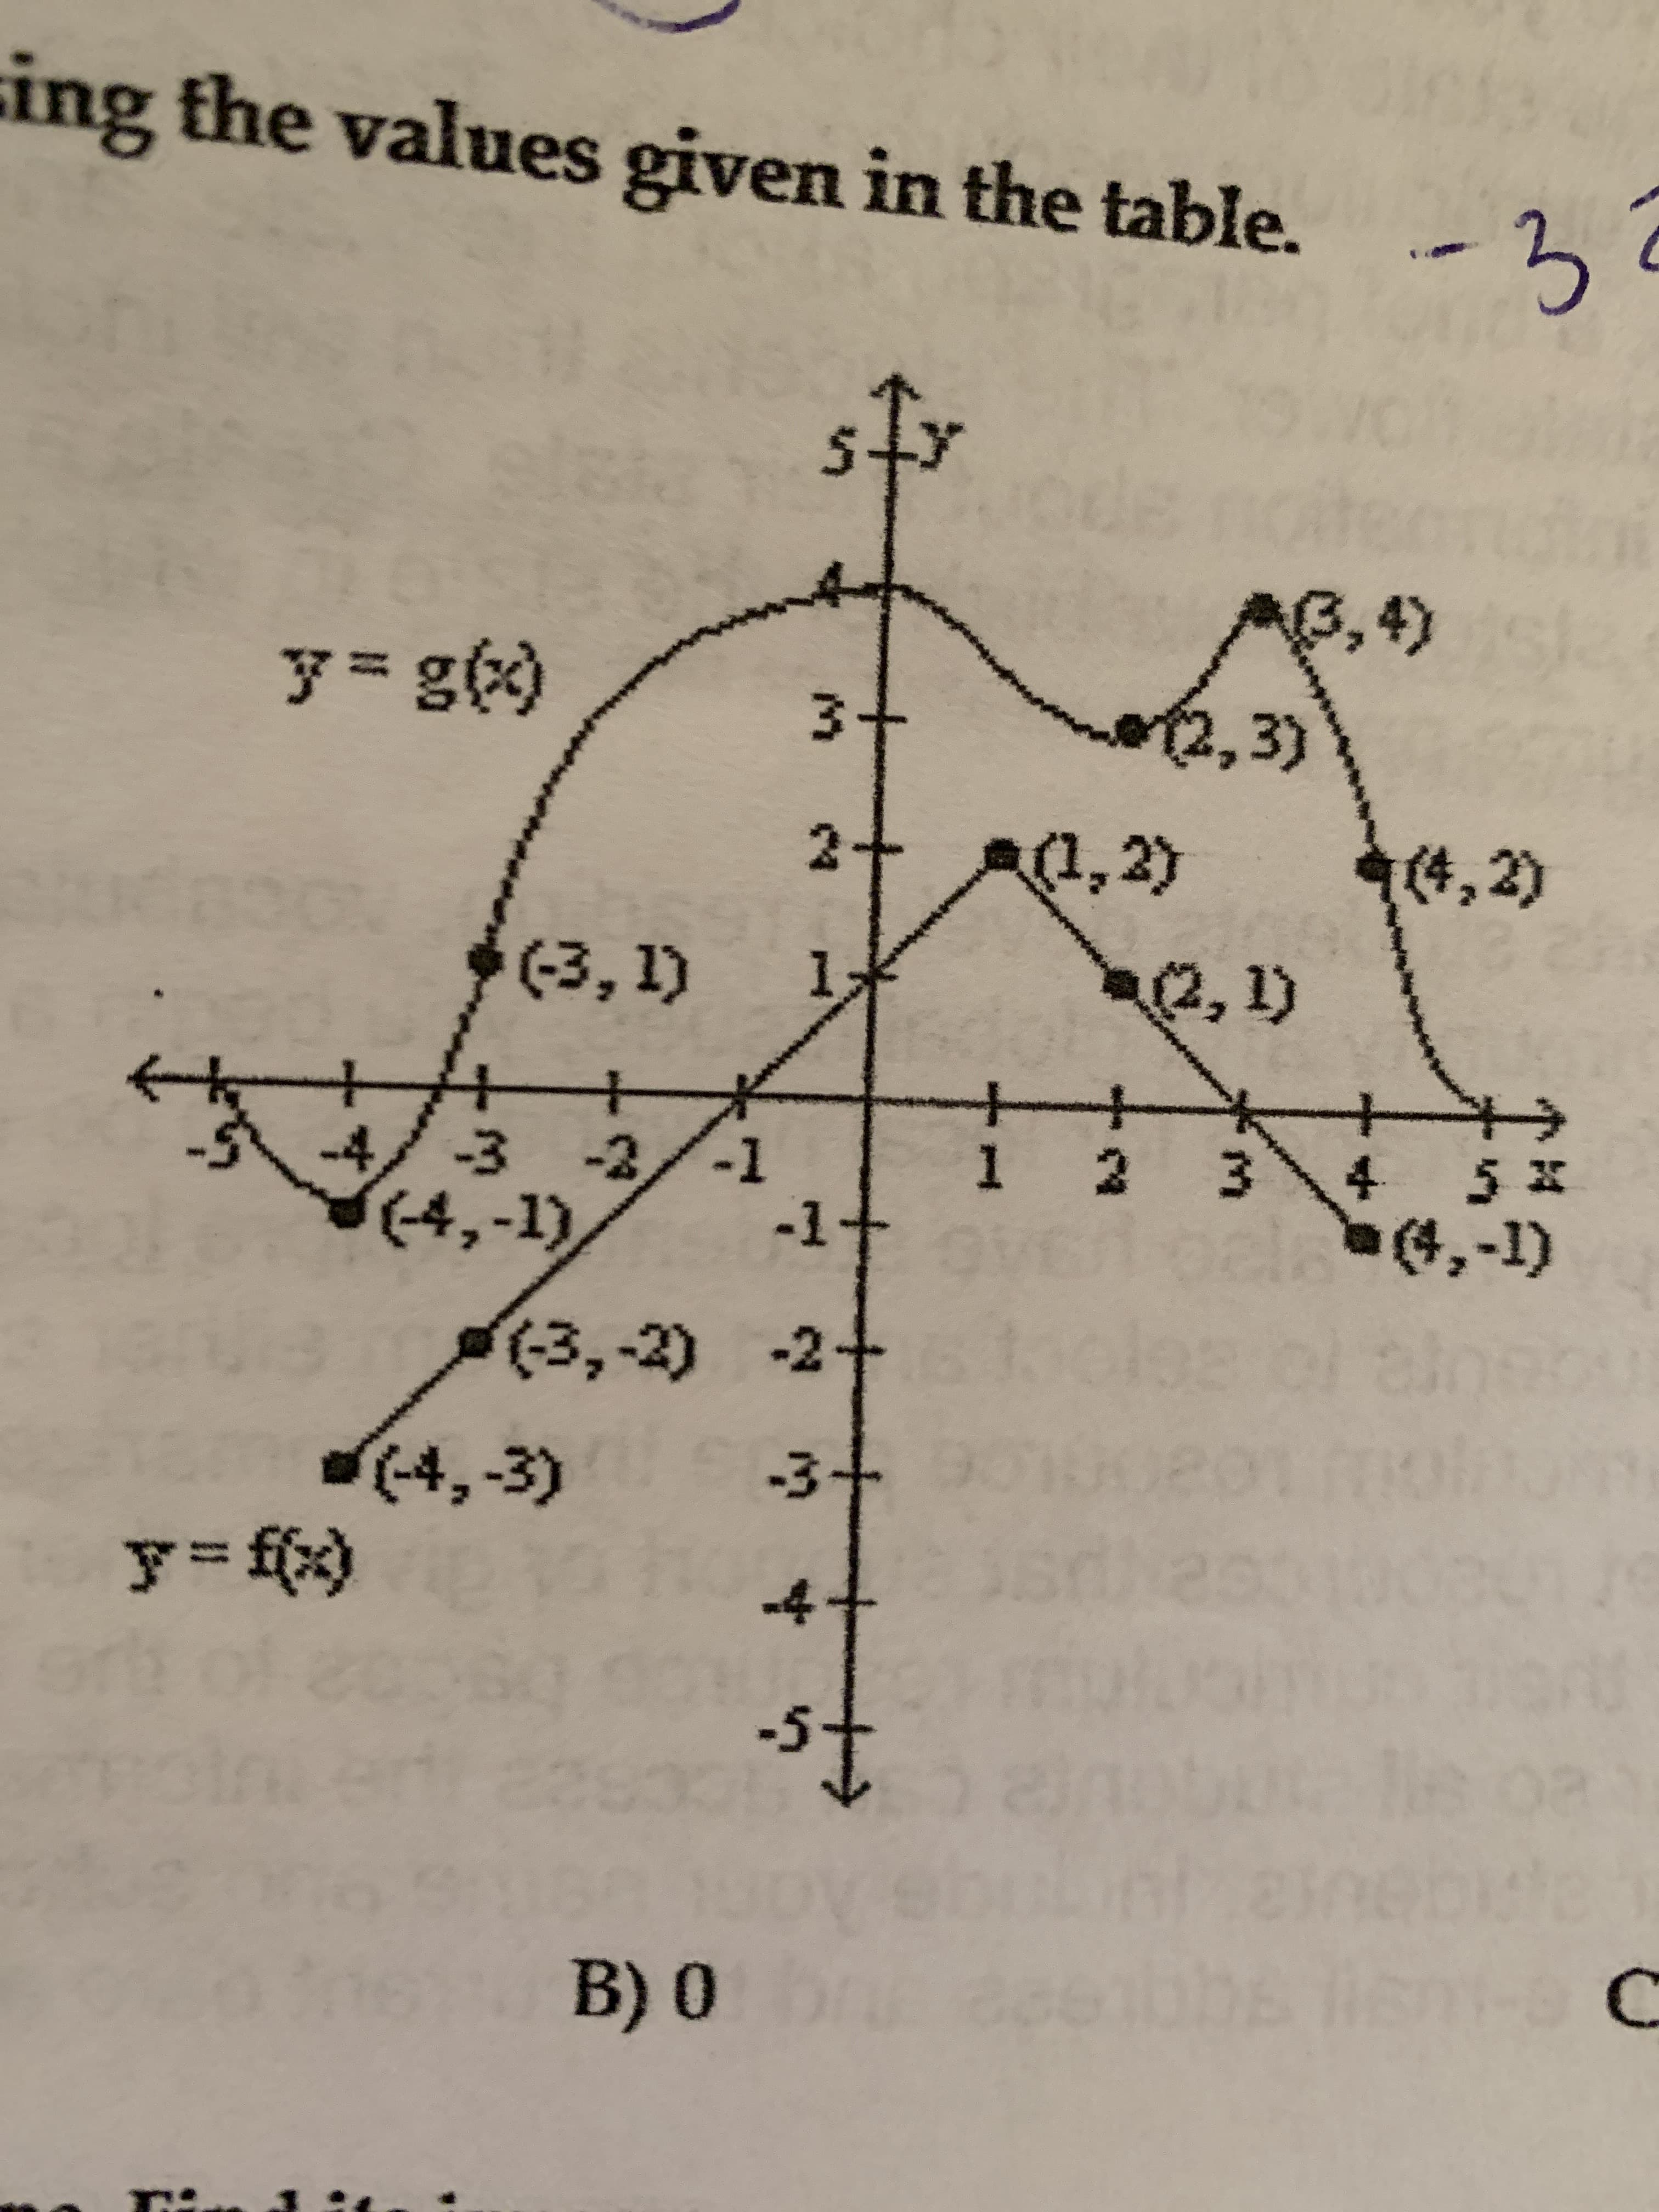
Evaluate the expression using the vales given in the table
f(g(-3))
A)1
B)0
C)2
D)-3


Trending now
This is a popular solution!

Step by step
Solved in 2 steps with 2 images


- Q5. (i) Prices of chocolates each (OMR.): 0.10, 0.19, 0.11, 0.19, 0.17, 0.12, 0.12, 0.12, 0.10, 0.11, 0.13, 0.10, 0.09, 0.11, 0.15,0.13, 0.10, 0.18, 0.09, 0.07, 0.08, 0.06, 0.08, 0.05, 0.07, 0.08, 0.08, 0.07, 0.09, 0.06,0.07, 0.08, 0.07, 0.07, 0.07, 0.08, 0.06, 0.07, 0.06Using 6 class intervals with the lowest starting at 0.05.Set up frequency distributionConstruct frequency histogram (ii) How many ways of four-digit odd numbers can be formed from the set of digits A= {5,6,2,7,4,9,3} if the repetition of digit is not allowedThe boxplots for the grade scores in the midterm exam in a Calculus I class for two different classes is attachedClass 1: Q1= 65 M= 70 Q3 = 80Class 2: Q1= 60 M= 70 Q3 = 75Which class is likely to have a greater percentage of students with grades smaller or equal to 70? Class 2 Class 1 It is impossible to tell. Neither Both classes are about equal. Which class has 50% percentage of students with grades between 70 and 80? Class 2 Both classes are about equal. Neither It is impossible to tell. Class 1 For which class did 25% of students receive grades between 60 and 70? Both classes are about equal. Class 1 Class 2 Neither It is impossible to tell.Wetlands offer a diversity of benefits. They provide a habitat for wildlife, spawning grounds for U.S. commercial fish, and renewable timber resources. In the last 200 years, the United States has lost more than half its wetlands. Environmental Almanac gives the percentage of wetlands lost in each state in the last 200 years. For the 30 of the lower 48 states, the percentage loss of wetlands per state is as follows. Percent of Wetlands Lost 0 9 1 NONE 2 ? 3 ? 4 ? 5 ? 6 0 8 7 1 8 3 7 9 9 0
- Wetlands offer a diversity of benefits. They provide a habitat for wildlife, spawning grounds for U.S. commercial fish, and renewable timber resources. In the last 200 years, the United States has lost more than half its wetlands. Environmental Almanac gives the percentage of wetlands lost in each state in the last 200 years. For the 30 of the lower 48 states, the percentage loss of wetlands per state is as follows. Percent of Wetlands Lost 0 9 1 NONE 2 ? 3 ? 4 ? 5 ? 6 0 8 7 1 8 3 7 9 9 0 Make a stem-and-leaf display of these data. (Use the tens digit as the stem and the ones digit as the leaf. Enter NONE in any unused answer blanks.)An analyst in the real estate business is interested in the relationship between the cost of the monthly rent of an apartment and the size of an apartment, in big cities. She gathers data for apartment buildings in 12 cities in 12 different states. In each city, she gets the numbers for at least 5 different buildings and at least 40 apartments in each building. She reaches the following conclusion: the rental cost of a 2-bedroom apartment is 50% more than the rental cost of a 1-bedroom apartment, and the rental cost of a 3-bedroom apartment is 50% more than the rental cost of a 2-bedroom apartment. Based on the paragraph, what is the minimum number of apartments she collected data on? Do you think her sample was large enough to be statistically valid? Based on the paragraph, are there any apartments or apartment buildings that she would have excluded from her study? Do you see any bias in how she selected apartments for her study? Based on the paragraph, is there a positive…A rehabilitation counselor believes that an increase in the number of social visits to a patient over the course of a week in the hospital will increase the patient's daily levels of positive mood. The counselor ensures that patients are limited to only three people during each visit. What is the alternative hypothesis for this relationship? A. H1 : ρ < 0 B. H1 : ρ > 0 C. H1 : r < 0 D. H1 : r ≤ 0
- To compute a student's Grade Point Average (GPA) for a term, the student's grades for each course are weighted by the number of credits for the course. Suppose a student had these grades: 4.0 in a 5 credit Math course 2.0 in a 3 credit Music course 2.9 in a 4 credit Chemistry course 3.1 in a 5 credit Journalism course What is the student's GPA for that term? Round to two decimal places. Student's GPA =A retailer wants to see if a red "Sale" sign brings in the same amount of revenue than the same "Sale" sign in blue. The data below shows the revenue in thousands of dollars that was achieved for various days when the retailer decided to put the red "Sale" sign up and days when the retailer decided to put the blue "Sale" sign up. Red: 2.4, 3, 3.6, 1.8, 3, 2.7, 2.9, 3, 3.1 Blue: 1.7, 2.1, 1.4, 2.6, 0.6, 3, 3.5, 1.6, 0.3 Assume that both populations follow a normal distribution. What can be concluded at the αα = 0.05 level of significance level of significance? The test statistic ? t = _______________ (please show your answer to 3 decimal places.) The p-value = __________________ (Please show your answer to 4 decimal places.)A researcher want to know if there is a relationship between sleep and anxiety. The researcher randomly selected n = 5 participants and asked each to rate their sleep quality and anxiety level on a scale of 1 to 5. The data are below: Sleep X Anxiety Y 2 2 3 3 2 2 4 2 5 2 Calcuate the Sum of Products (SP).
- K:56) Somehow you manage to build a fair 3-sided die, equally likely to show 1, 2, or 3 every time it is rolled. You roll the die twice, with the results each time being independent. If X is the maximum of the 2 numbers rolled and Y is the sum of the 2 numbers rolled, find the correlation ρ(X, Y ).A retailer wants to see if a red "Sale" sign brings in more revenue than the same "Sale" sign in blue. The data below shows the revenue in thousands of dollars that was achieved for various days when the retailer decided to put the red "Sale" sign up and days when the retailer decided to put the blue "Sale" sign up. Red: 3.7, 3.9, 2.7, 3.6, 2.5, 2.8, 3.2, 4.4, 3.9 Blue: 1, 2.1, 2, 3, 2.8, 3.1, 2.5, 3.4, 3.6 Assume that both populations follow a normal distribution. What can be concluded at the � = 0.05 level of significance level of significance?A retailer wants to see if a red "Sale" sign brings in less revenue than the same "Sale" sign in blue. The data below shows the revenue in thousands of dollars that was achieved for various days when the retailer decided to put the red "Sale" sign up and days when the retailer decided to put the blue "Sale" sign up. Red: 2.6, 3.2, 3.4, 1, 2.6, 4.6, 2.7, 3.3, 3.2, 2.4 Blue: 3.7, 4.6, 4.2, 4.1, 3.6, 2.1, 4.7, 3.6 Assume that both populations follow a normal distribution. What can be concluded at the α = 0.05 level of significance level of significance? For this study, we should use? The null and alternative hypotheses would be: H0: (please enter a decimal) H1: (Please enter a decimal) The test statistic = (please show your answer to 3 decimal places.) The p-value = (Please show your answer to 4 decimal places.) The p-value is ? α Based on this, we should ? the null hypothesis. Thus, the final conclusion…
