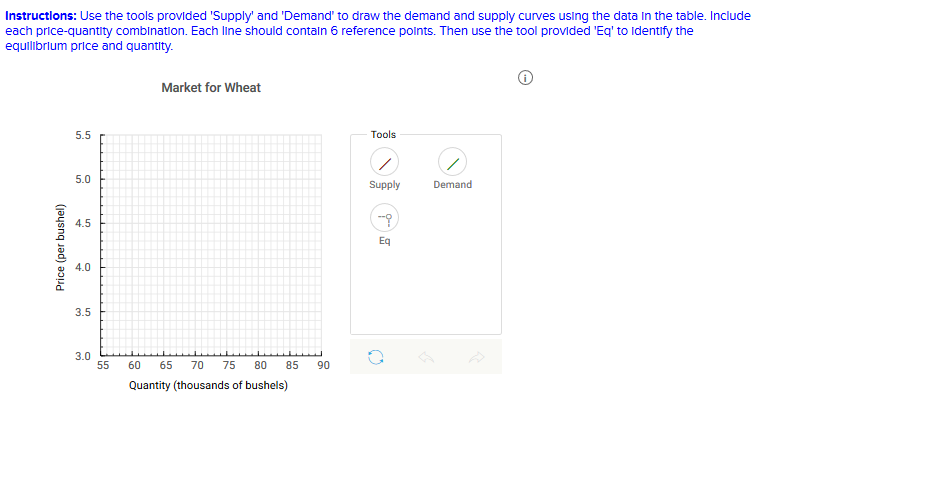
Instructlons: Use the tools provided 'Supply' and 'Demand' to draw the demand and supply curves using the data in the table. Include each price-quantity combination. Each line should contaln 6 reference polnts. Then use the tool provided 'Eq' to Identify the equilibrlum price and quantity. Market for Wheat Tools 5.5 5.0 Demand Supply 4.5 Eq 4.0 3.5 3.0 55 60 65 70 75 80 85 90 Quantity (thousands of bushels) Price (per bushel)


Instructions: Enter your answers as whole numbers. If you are entering any negative numbers be sure to include a negative sign (-) in front of those numbers.
|
a. What is the
At what price is there neither a shortage nor a surplus?
b. Graph the demand for wheat and the supply of wheat. Be sure to locate the equilibrium price and quantity.
Instructions: Enter all numeric values without a minus sign.
c. How big is the surplus or shortage at $3.40?
There is a
of
How big is the surplus or shortage at $4.90?
There is a
of
d. How big a surplus or shortage results if the price is 60 cents higher than the equilibrium price?
e. How big a surplus or shortage results if the price is 30 cents lower than the equilibrium price?


Trending now
This is a popular solution!

Step by step
Solved in 4 steps with 1 images


