intense positive regard and social skills training. h period, nmeasured in terms of three categories: nizophrenic (improved), became more schizophrenic (got dependent variable is the worse), or showed no change. The different proportions of improvement among these four treatments can be tested for significance with the usual patient's six-step procedure. Step 1: State the Hypotheses In the case of the two-variable chi-square test, the null hypothesis is that there is no association or correlation between the two variables-that is, the way that one of the variables is distributed into categories does not change at different levels of the second variable. Stated yet another way, the null hypothesis asserts that the two variables are other. Hence this test is often called the chi-square test for independence. For this example, the null hypothesis is Ho method of treatment and degree of parents reverse seems ivorce. nd that he next independent of each decide independent. As usual, the alternative hypothesis is the vorce is improvement are have to negation of Ho; HA: method of treatment and degree of improvement are not would oblems, independent. in each Step 2: Select the Statistical Test and the Significance Level The data consist of the frequencies in categories arranged along two dimensions, so the two-way chi-square test is appropriate. As usual we mind us and this ariables expects Dr.Null will set alpha = 05 Step 3: Select the Samples and Collect the Data Eighty schizophrenics meeting certain criteria (not responsive to previous treatment, more than a certain number of years on the ward, etc.) are selected and then assigned at random to the four treatments, with the constraint that 20 are assigned to each group. After 6 months of treatment, each patient is rated as having improved, having gotten worse, or having remained the same. The data are displayed in Table 20.6, a 3 x4 contingency ects that he ratios the ratio h row of r finding table. Therapy Economy Row Sums 30 Token Group Psychodynamic Rogerian Therapy Therapy Observed 12 28 8 Frequencies 5 4 22 3 6 3 Improved No change 14 2 N= 80 6 20 8 Got worse 20 Column sums 20 ed which over who
intense positive regard and social skills training. h period, nmeasured in terms of three categories: nizophrenic (improved), became more schizophrenic (got dependent variable is the worse), or showed no change. The different proportions of improvement among these four treatments can be tested for significance with the usual patient's six-step procedure. Step 1: State the Hypotheses In the case of the two-variable chi-square test, the null hypothesis is that there is no association or correlation between the two variables-that is, the way that one of the variables is distributed into categories does not change at different levels of the second variable. Stated yet another way, the null hypothesis asserts that the two variables are other. Hence this test is often called the chi-square test for independence. For this example, the null hypothesis is Ho method of treatment and degree of parents reverse seems ivorce. nd that he next independent of each decide independent. As usual, the alternative hypothesis is the vorce is improvement are have to negation of Ho; HA: method of treatment and degree of improvement are not would oblems, independent. in each Step 2: Select the Statistical Test and the Significance Level The data consist of the frequencies in categories arranged along two dimensions, so the two-way chi-square test is appropriate. As usual we mind us and this ariables expects Dr.Null will set alpha = 05 Step 3: Select the Samples and Collect the Data Eighty schizophrenics meeting certain criteria (not responsive to previous treatment, more than a certain number of years on the ward, etc.) are selected and then assigned at random to the four treatments, with the constraint that 20 are assigned to each group. After 6 months of treatment, each patient is rated as having improved, having gotten worse, or having remained the same. The data are displayed in Table 20.6, a 3 x4 contingency ects that he ratios the ratio h row of r finding table. Therapy Economy Row Sums 30 Token Group Psychodynamic Rogerian Therapy Therapy Observed 12 28 8 Frequencies 5 4 22 3 6 3 Improved No change 14 2 N= 80 6 20 8 Got worse 20 Column sums 20 ed which over who

Glencoe Algebra 1, Student Edition, 9780079039897, 0079039898, 2018
18th Edition
ISBN:9780079039897
Author:Carter
Publisher:Carter
Chapter10: Statistics
Section10.3: Measures Of Spread
Problem 1GP

Related questions
Question
Steps 1,2, and three
Transcribed Image Text:intense
positive regard
and social skills training.
h period, nmeasured in terms of three categories:
nizophrenic (improved), became more schizophrenic (got
dependent variable is the
worse), or showed no change. The different proportions of improvement
among these four treatments can be tested for significance with the usual
patient's
six-step procedure.
Step 1: State the Hypotheses
In the case of the two-variable chi-square test, the null hypothesis is that
there is no association or correlation between the two variables-that is,
the way that one of the variables is distributed into categories does not
change at different levels of the second variable. Stated yet another way,
the null hypothesis asserts that the two variables are
other. Hence this test is often called the chi-square test for independence. For
this example, the null hypothesis is Ho method of treatment and degree of
parents
reverse
seems
ivorce.
nd that
he next
independent of each
decide
independent. As usual, the alternative hypothesis is the
vorce is
improvement are
have to
negation of Ho; HA: method of treatment and degree of improvement are not
would
oblems,
independent.
in each
Step 2: Select the Statistical Test and the Significance Level
The data consist of the frequencies in categories arranged along two
dimensions, so the two-way chi-square test is appropriate. As usual we
mind us
and this
ariables
expects
Dr.Null
will set alpha = 05
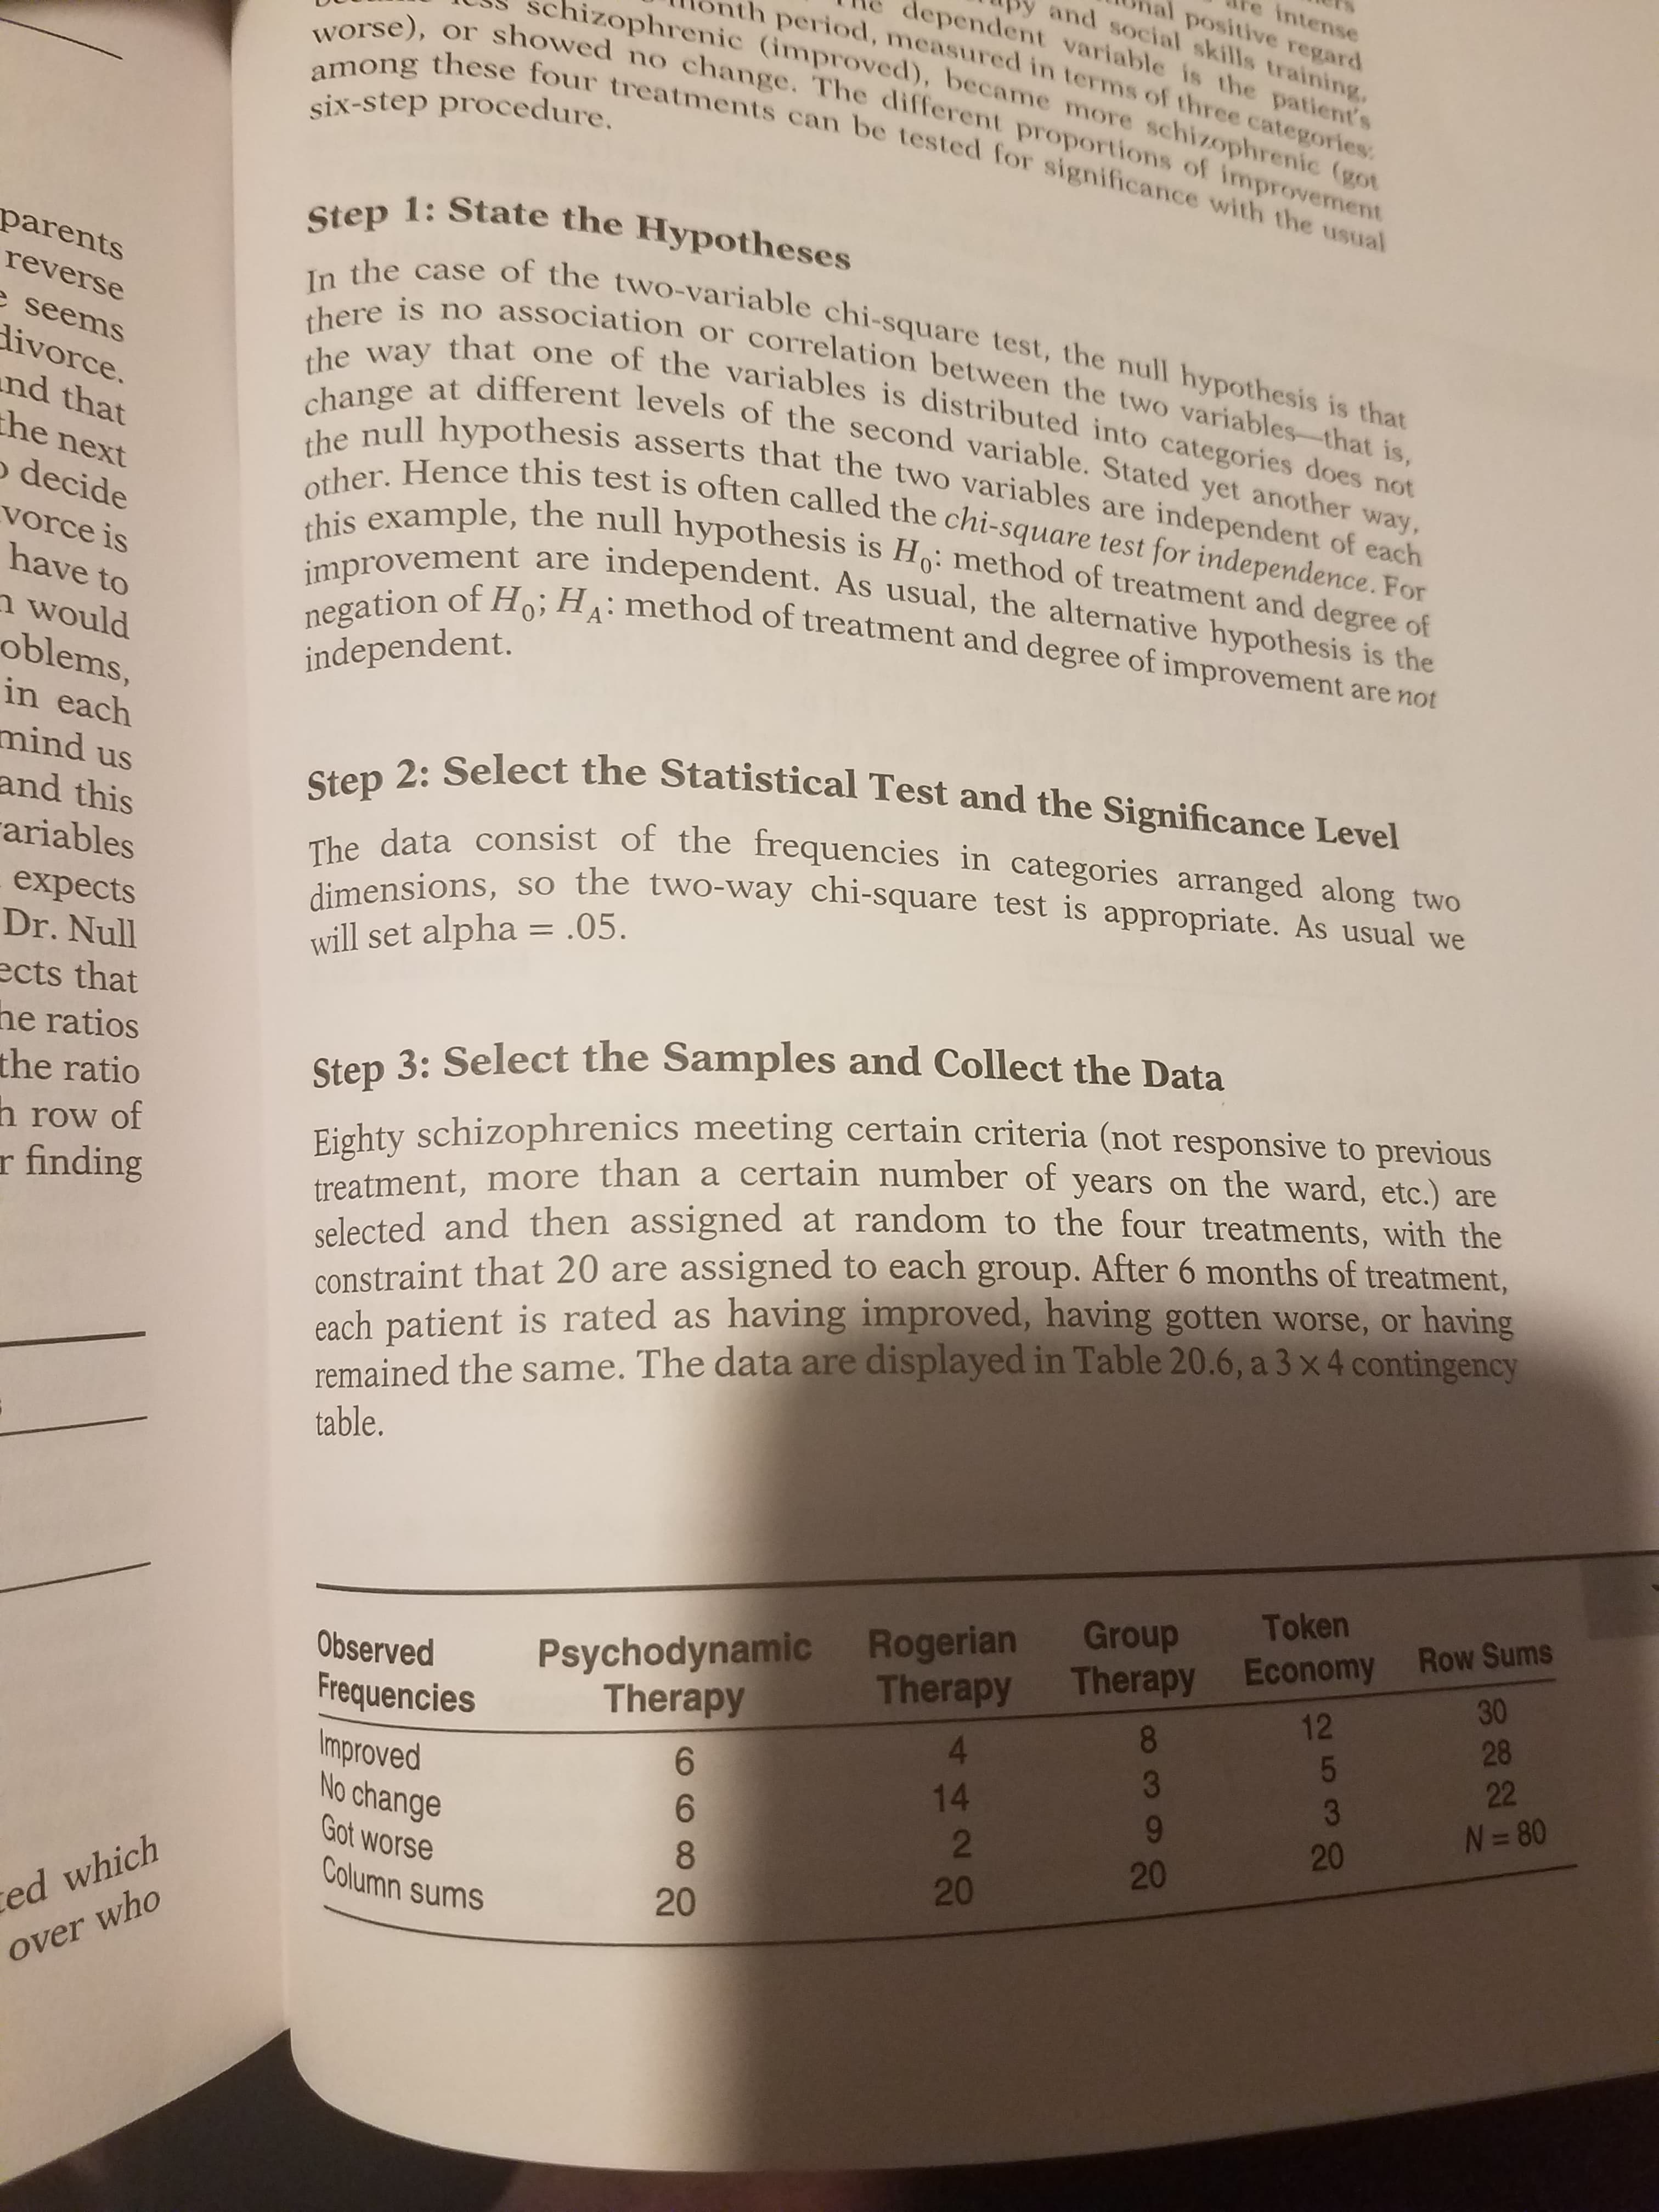
Step 3: Select the Samples and Collect the Data
Eighty schizophrenics meeting certain criteria (not responsive to previous
treatment, more than a certain number of years on the ward, etc.) are
selected and then assigned at random to the four treatments, with the
constraint that 20 are assigned to each group. After 6 months of treatment,
each patient is rated as having improved, having gotten worse, or having
remained the same. The data are displayed in Table 20.6, a 3 x4 contingency
ects that
he ratios
the ratio
h row of
r finding
table.
Therapy Economy Row Sums
30
Token
Group
Psychodynamic Rogerian
Therapy
Therapy
Observed
12
28
8
Frequencies
5
4
22
3
6
3
Improved
No change
14
2
N= 80
6
20
8
Got worse
20
Column sums
20
ed which
over who
Expert Solution
This question has been solved!
Explore an expertly crafted, step-by-step solution for a thorough understanding of key concepts.

Step by step
Solved in 2 steps with 1 images

Knowledge Booster


Learn more about
Need a deep-dive on the concept behind this application? Look no further. Learn more about this topic, statistics and related others by exploring similar questions and additional content below.Recommended textbooks for you
Glencoe Algebra 1, Student Edition, 9780079039897…
Algebra
ISBN:
9780079039897
Author:
Carter
Publisher:
McGraw Hill
Glencoe Algebra 1, Student Edition, 9780079039897…
Algebra
ISBN:
9780079039897
Author:
Carter
Publisher:
McGraw Hill