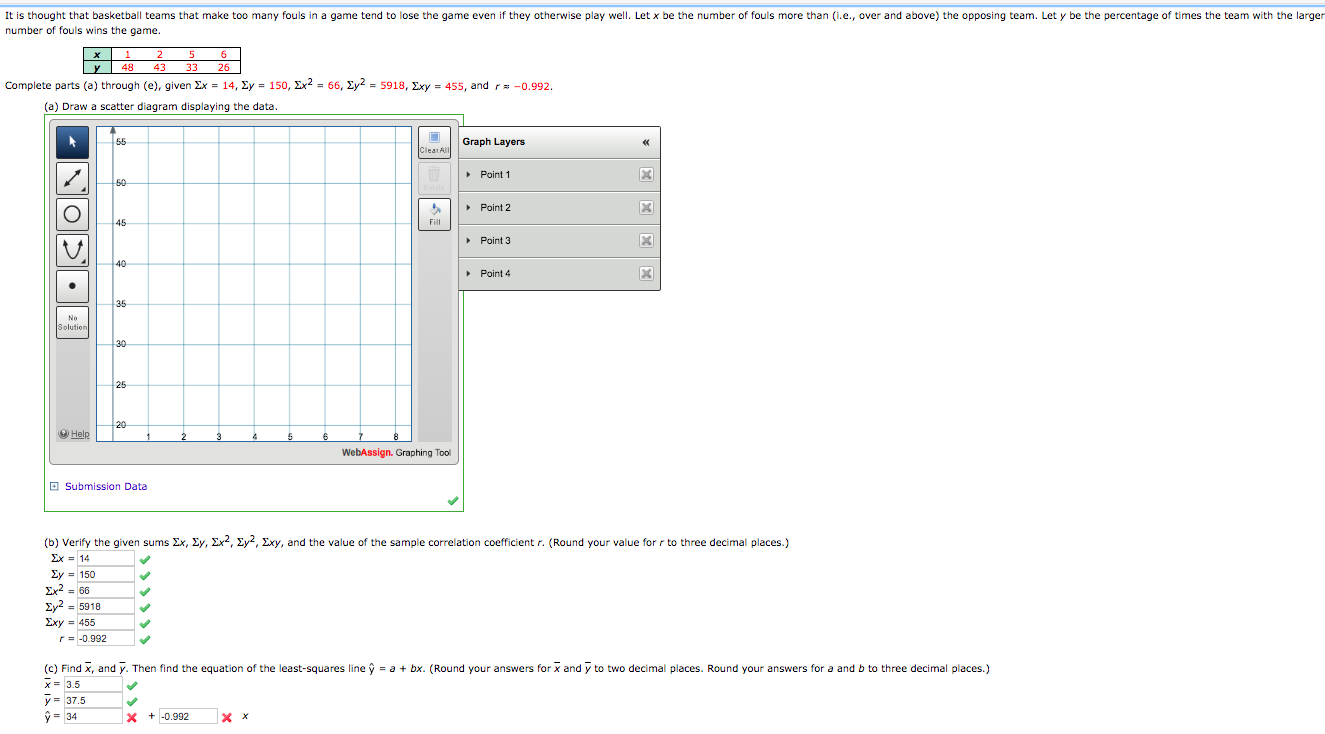
It is thought that basketball teams that make too many fouls in a game tend to lose the game even if they otherwise play well. Let x be the number of fouls more than (i.e., over and above) the opposing team. Let y be the percentage of times the team with the larger number of fouls wins the game. х 6. |y 48 43 33 26 Complete parts (a) through (e), given Ex = 14, Ey = 150, Ex2 = 66, Ey2 = 5918, Exy = 455, and r= -0.992. (a) Draw a scatter diagram displaying the data. 55 Graph Layers Cleat All • Point 1 50 • Point 2 45 Fill • Point 3 40 • Point 4 35 No Solution 30 25 20 O Help WebAssign. Graphing Tool O Submission Data (b) Verify the given sums Ex, Ey, Ex2, Ey2, Exy, and the value of the sample correlation coefficient r. (Round your value for r to three decimal places.) Ex = 14 Ey = 150 Ex = 66 Ey2 = 5918 Σγ2 Exy = 455 r= -0.992 (c) Find x, and y. Then find the equation of the least-squares line ŷ = a + bx. (Round your answers for x and y to two decimal places. Round your answers for a and b to three decimal places.) X= 3.5 y = 37.5 ý = 34 X* + -0.992 (d) Graph the least-squares line. Be sure to plot the point (x, y) as a point on the line. y 55 55 50 50 45 45 40 40 35 35 30 30 25 25 20 х 20 2 4 8 4 55 55 50 50 45 45 40 40 35 35 30 30 25 25 20 х 8. 20 4 6. 6. (e) Find the value of the coefficient of determination r2. What percentage of the variation in y can be explained by the corresponding variation in x and the least-squares line? What percentage is unexplained? (Round your answer for r2 to three decimal places. Round your answers for the percentages to one decimal place.) 2 - -0.9 x explained unexplained (f) If a team had x = 4 fouls over and above the opposing team, what does the least-squares equation forecast for y? (Round your answer to two decimal places.)
It is thought that basketball teams that make too many fouls in a game tend to lose the game even if they otherwise play well. Let x be the number of fouls more than (i.e., over and above) the opposing team. Let y be the percentage of times the team with the larger number of fouls wins the game. х 6. |y 48 43 33 26 Complete parts (a) through (e), given Ex = 14, Ey = 150, Ex2 = 66, Ey2 = 5918, Exy = 455, and r= -0.992. (a) Draw a scatter diagram displaying the data. 55 Graph Layers Cleat All • Point 1 50 • Point 2 45 Fill • Point 3 40 • Point 4 35 No Solution 30 25 20 O Help WebAssign. Graphing Tool O Submission Data (b) Verify the given sums Ex, Ey, Ex2, Ey2, Exy, and the value of the sample correlation coefficient r. (Round your value for r to three decimal places.) Ex = 14 Ey = 150 Ex = 66 Ey2 = 5918 Σγ2 Exy = 455 r= -0.992 (c) Find x, and y. Then find the equation of the least-squares line ŷ = a + bx. (Round your answers for x and y to two decimal places. Round your answers for a and b to three decimal places.) X= 3.5 y = 37.5 ý = 34 X* + -0.992 (d) Graph the least-squares line. Be sure to plot the point (x, y) as a point on the line. y 55 55 50 50 45 45 40 40 35 35 30 30 25 25 20 х 20 2 4 8 4 55 55 50 50 45 45 40 40 35 35 30 30 25 25 20 х 8. 20 4 6. 6. (e) Find the value of the coefficient of determination r2. What percentage of the variation in y can be explained by the corresponding variation in x and the least-squares line? What percentage is unexplained? (Round your answer for r2 to three decimal places. Round your answers for the percentages to one decimal place.) 2 - -0.9 x explained unexplained (f) If a team had x = 4 fouls over and above the opposing team, what does the least-squares equation forecast for y? (Round your answer to two decimal places.)

MATLAB: An Introduction with Applications
6th Edition
ISBN:9781119256830
Author:Amos Gilat
Publisher:Amos Gilat
Chapter1: Starting With Matlab
Section: Chapter Questions
Problem 1P

Related questions
Question
Transcribed Image Text:It is thought that basketball teams that make too many fouls in a game tend to lose the game even if they otherwise play well. Let x be the number of fouls more than (i.e., over and above) the opposing team. Let y be the percentage of times the team with the larger
number of fouls wins the game.
х
6.
|y 48
43
33
26
Complete parts (a) through (e), given Ex = 14, Ey = 150, Ex2 = 66, Ey2 = 5918, Exy = 455, and r= -0.992.
(a) Draw a scatter diagram displaying the data.
55
Graph Layers
Cleat All
• Point 1
50
• Point 2
45
Fill
• Point 3
40
• Point 4
35
No
Solution
30
25
20
O Help
WebAssign. Graphing Tool
O Submission Data
(b) Verify the given sums Ex, Ey, Ex2, Ey2, Exy, and the value of the sample correlation coefficient r. (Round your value for r to three decimal places.)
Ex = 14
Ey = 150
Ex = 66
Ey2 = 5918
Σγ2
Exy = 455
r= -0.992
(c) Find x, and y. Then find the equation of the least-squares line ŷ = a + bx. (Round your answers for x and y to two decimal places. Round your answers for a and b to three decimal places.)
X= 3.5
y = 37.5
ý = 34
X* + -0.992
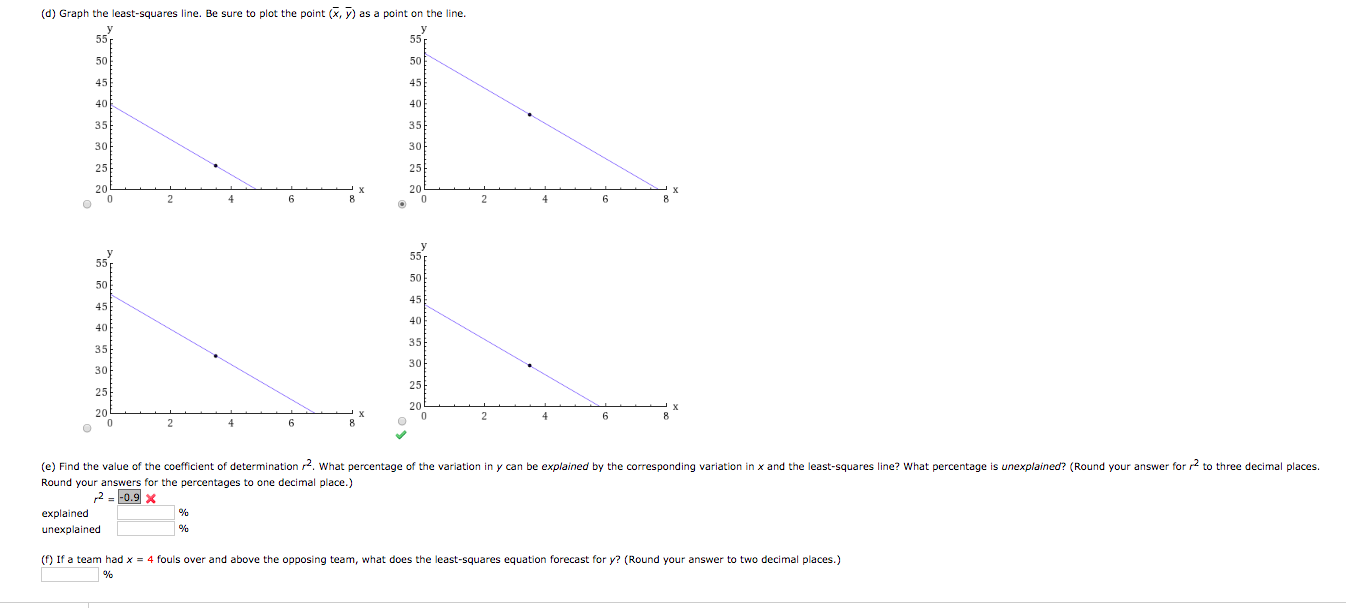
Transcribed Image Text:(d) Graph the least-squares line. Be sure to plot the point (x, y) as a point on the line.
y
55
55
50
50
45
45
40
40
35
35
30
30
25
25
20
х
20
2
4
8
4
55
55
50
50
45
45
40
40
35
35
30
30
25
25
20
х
8.
20
4
6.
6.
(e) Find the value of the coefficient of determination r2. What percentage of the variation in y can be explained by the corresponding variation in x and the least-squares line? What percentage is unexplained? (Round your answer for r2 to three decimal places.
Round your answers for the percentages to one decimal place.)
2 - -0.9 x
explained
unexplained
(f) If a team had x = 4 fouls over and above the opposing team, what does the least-squares equation forecast for y? (Round your answer to two decimal places.)
Expert Solution
This question has been solved!
Explore an expertly crafted, step-by-step solution for a thorough understanding of key concepts.

This is a popular solution!

Trending now
This is a popular solution!

Step by step
Solved in 3 steps with 4 images

Recommended textbooks for you
MATLAB: An Introduction with Applications
Statistics
ISBN:
9781119256830
Author:
Amos Gilat
Publisher:
John Wiley & Sons Inc

Probability and Statistics for Engineering and th…
Statistics
ISBN:
9781305251809
Author:
Jay L. Devore
Publisher:
Cengage Learning

Statistics for The Behavioral Sciences (MindTap C…
Statistics
ISBN:
9781305504912
Author:
Frederick J Gravetter, Larry B. Wallnau
Publisher:
Cengage Learning
MATLAB: An Introduction with Applications
Statistics
ISBN:
9781119256830
Author:
Amos Gilat
Publisher:
John Wiley & Sons Inc
Probability and Statistics for Engineering and th…
Statistics
ISBN:
9781305251809
Author:
Jay L. Devore
Publisher:
Cengage Learning
Statistics for The Behavioral Sciences (MindTap C…
Statistics
ISBN:
9781305504912
Author:
Frederick J Gravetter, Larry B. Wallnau
Publisher:
Cengage Learning

Elementary Statistics: Picturing the World (7th E…
Statistics
ISBN:
9780134683416
Author:
Ron Larson, Betsy Farber
Publisher:
PEARSON

The Basic Practice of Statistics
Statistics
ISBN:
9781319042578
Author:
David S. Moore, William I. Notz, Michael A. Fligner
Publisher:
W. H. Freeman

Introduction to the Practice of Statistics
Statistics
ISBN:
9781319013387
Author:
David S. Moore, George P. McCabe, Bruce A. Craig
Publisher:
W. H. Freeman