James consumes burgers and pies. His income is $20, and when burgers and pies both cost $1, James consumes 4 burgers and 16 pies (Draw a point A name it Figure A). But when the price of pies rises to $2, James consumes 12 burgers and 4 pies (show point B in Figure A). a. Why does the budget constraint shift/rotate as it does in response to the increase in the price of pies? Show this shift/rotate in figure A with actual number provided above. b. Draw the diagram (name it Figure B) on a piece of paper. On your diagram, separate the change in the consumption of pies into the substitution effect and the income effect. Which is larger? Are pies a normal or inferior good? How do you know? Are burgers a normal or inferior good? How do you know? c.
James consumes burgers and pies. His income is $20, and when burgers and pies both cost $1, James consumes 4 burgers and 16 pies (Draw a point A name it Figure A). But when the price of pies rises to $2, James consumes 12 burgers and 4 pies (show point B in Figure A). a. Why does the budget constraint shift/rotate as it does in response to the increase in the price of pies? Show this shift/rotate in figure A with actual number provided above. b. Draw the diagram (name it Figure B) on a piece of paper. On your diagram, separate the change in the consumption of pies into the substitution effect and the income effect. Which is larger? Are pies a normal or inferior good? How do you know? Are burgers a normal or inferior good? How do you know? c.

Principles of Microeconomics
7th Edition
ISBN:9781305156050
Author:N. Gregory Mankiw
Publisher:N. Gregory Mankiw
Chapter21: The Theory Of Consumer Choice
Section: Chapter Questions
Problem 1PA

Related questions
Question
please solve the question in the image below
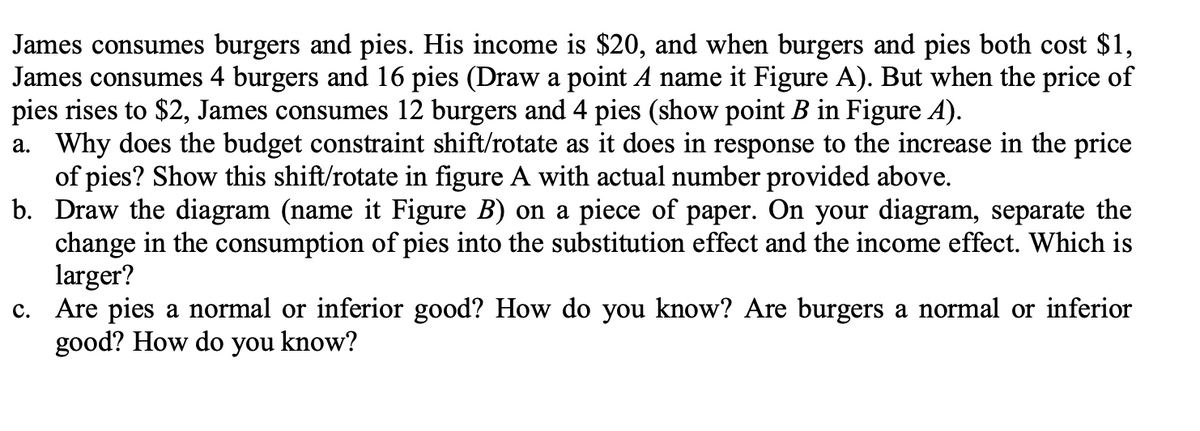
Transcribed Image Text:James consumes burgers and pies. His income is $20, and when burgers and pies both cost $1,
James consumes 4 burgers and 16 pies (Draw a point A name it Figure A). But when the price of
pies rises to $2, James consumes 12 burgers and 4 pies (show point B in Figure A).
a. Why does the budget constraint shift/rotate as it does in response to the increase in the price
of pies? Show this shift/rotate in figure A with actual number provided above.
b. Draw the diagram (name it Figure B) on a piece of paper. On your diagram, separate the
change in the consumption of pies into the substitution effect and the income effect. Which is
larger?
c. Are pies a normal or inferior good? How do you know? Are burgers a normal or inferior
good? How do you know?
Expert Solution
This question has been solved!
Explore an expertly crafted, step-by-step solution for a thorough understanding of key concepts.

This is a popular solution!

Trending now
This is a popular solution!

Step by step
Solved in 2 steps with 5 images

Knowledge Booster


Learn more about
Need a deep-dive on the concept behind this application? Look no further. Learn more about this topic, economics and related others by exploring similar questions and additional content below.Recommended textbooks for you
Principles of Microeconomics
Economics
ISBN:
9781305156050
Author:
N. Gregory Mankiw
Publisher:
Cengage Learning

Principles of Economics (MindTap Course List)
Economics
ISBN:
9781305585126
Author:
N. Gregory Mankiw
Publisher:
Cengage Learning

Exploring Economics
Economics
ISBN:
9781544336329
Author:
Robert L. Sexton
Publisher:
SAGE Publications, Inc
Principles of Microeconomics
Economics
ISBN:
9781305156050
Author:
N. Gregory Mankiw
Publisher:
Cengage Learning
Principles of Economics (MindTap Course List)
Economics
ISBN:
9781305585126
Author:
N. Gregory Mankiw
Publisher:
Cengage Learning
Exploring Economics
Economics
ISBN:
9781544336329
Author:
Robert L. Sexton
Publisher:
SAGE Publications, Inc


Economics: Private and Public Choice (MindTap Cou…
Economics
ISBN:
9781305506725
Author:
James D. Gwartney, Richard L. Stroup, Russell S. Sobel, David A. Macpherson
Publisher:
Cengage Learning

Microeconomics: Private and Public Choice (MindTa…
Economics
ISBN:
9781305506893
Author:
James D. Gwartney, Richard L. Stroup, Russell S. Sobel, David A. Macpherson
Publisher:
Cengage Learning