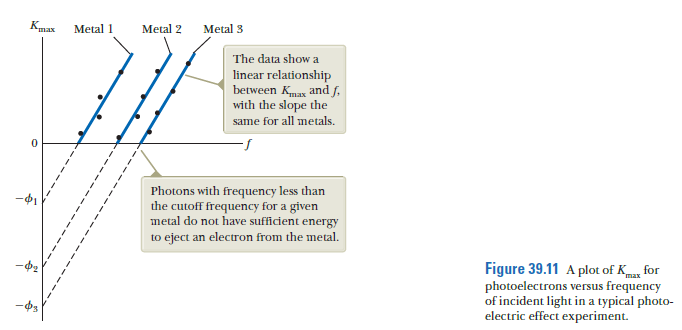
Kax Metal 1 Metal 2 Metal 3 The data show a linear relationship between Kmax and f, with the slope the same for all metals. Photons with frequency less than the cutoff frequency for a given metal do not have sufficient energy to eject an electron from the metal. Figure 39.11 A plot of K photoelectrons versus frequency of incident light in a typical photo- electric effect experiment. for
Kax Metal 1 Metal 2 Metal 3 The data show a linear relationship between Kmax and f, with the slope the same for all metals. Photons with frequency less than the cutoff frequency for a given metal do not have sufficient energy to eject an electron from the metal. Figure 39.11 A plot of K photoelectrons versus frequency of incident light in a typical photo- electric effect experiment. for

Related questions
Question
Suppose classical physicists had the idea of plotting Kmax versus f as shown. Draw a graph of what the expected plot would look like, based on the wave model for light.
Transcribed Image Text:Kax
Metal 1
Metal 2
Metal 3
The data show a
linear relationship
between Kmax and f,
with the slope the
same for all metals.
Photons with frequency less than
the cutoff frequency for a given
metal do not have sufficient energy
to eject an electron from the metal.
Figure 39.11 A plot of K
photoelectrons versus frequency
of incident light in a typical photo-
electric effect experiment.
for
Expert Solution
This question has been solved!
Explore an expertly crafted, step-by-step solution for a thorough understanding of key concepts.

This is a popular solution!

Trending now
This is a popular solution!

Step by step
Solved in 2 steps with 2 images
