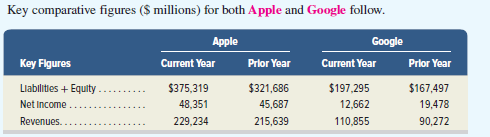
Key comparative figures ($ millions) for both Apple and Google follow. Apple Google Key Figures Current Year Prior Year Current Year Prlor Year Liabilittes + Equity. $375,319 $321,686 $197,295 $167,497 Net Income 48,351 45,687 12,662 19,478 Revenues. 229,234 215,639 110,855 90,272


Q: Q4. ABC Company has opening stock of $50000 purchased goods worth $150,000 during the year and…
A: Note: I am supposed to provide the solution of (Question number 4). Please repost the remaining…
Q: What is the amount of net income if ABC firm has the following balances in their accounts Sales…
A: Total revenue=Sale +Service revenue=JD 12,000+2,000=JD 14,000
Q: I was given only this document for an assignment: What is the Fiscal Year End Date?Amazon: December…
A: The accounting policies of various companies do differ as per their environment and internal control…
Q: Financial info to be used by surnames with initials (S, W, G, Z) Simple Things Industries Ltd.…
A: (1) The table below shows the comparative balance sheet of the company:
Q: Google reported the following in its 2013, Form 10K (in millions). Use the information to determine…
A: R&D Expenses: The expenses incurred by a company in developing, and designing new products…
Q: Financial info to be used by surnames with initials (S, W, G, Z) Simple Things Industries Ltd.…
A: The cash flow statement is the statement that shows all the inflows and outflows of cash and cash…
Q: Suppose these selected condensed data are taken from recent balance sheets of Bob Evans Farms (in…
A: Current ratio is a liquidity ratio, which measures the ability to pay current liabilities out of the…
Q: $ millions Total assets Total liabilities Total equity Apple Current Year $ 338,516 248, 028 90, 488…
A: The debt to equity ratio represents the availability of debt held in hands of the company as…
Q: From http://finance_yahoo.com/ the following current financial information for Apple Inc (AAPL), in…
A:
Q: Required information (The following information applies to the questions displayed below.) Following…
A: An Operating Segment must to be reported as the disclosures in notes of financial Statements if the…
Q: Times interest earned Averill Products Inc. reported the following on the company’s income…
A: Formula: Times Interest Ratio = Income before Interest and tax/ Interest Expense Times Interest…
Q: Rey figures för Apple and Google follow. S millions Cash and equivalents Accounts receivable, net…
A: Common size percentage is where each amount of balance sheet is expressed as percent of total assets…
Q: Two income statements for Paragon Company follow: Paragon Company Income Statements For the Years…
A: Horizontal analysis of financial statements means analysis of change in financial statements number…
Q: What is the return on assets for Samsung in the (a) current year and (b) prior year?
A: Financial Ratios: Financial ratios are the metrics used to evaluate the liquidity, capabilities,…
Q: The total assets and total liabilities for a recent year of Apple (AAPL) and HP (HPQ) formerly…
A: Asset = Stock holders' equity + Liabilities Stock holders' equity : Assets - Liabilities
Q: CommercialServices.com Corporation provides business-to-business services on the Internet. Data…
A: Roi is calculated as operating income divided by average operating assets.
Q: For the fiscal year ended September 28, 2019, what amount is debited to Income Summary to summarize…
A: At the end of each accounting period, the income summary account is used to close all income and…
Q: NIKE,INC Financial Statement Analysis The financial statements for Nike, Inc., are presented in…
A: A ratio is expressed as a quotient between two mathematical values and establishes the relationship…
Q: SEARCH ASK CHAT MATH SOLVER Question Selected information from the 2018 and 2017 financial…
A:
Q: Q3. Ramadhan Corporation has the following accounts included in its December 31, 2010, trial…
A: Current assets are those short term assets which can be converted into cash immediately or in short…
Q: Comprehenaive Problem TLC Company wus eatablished on January 1. 2015 and a engaged in the…
A: Working capital, also known as net working capital (NWC), is the difference between a company's…
Q: The following information is available for Advanced Micro Devices (AMD) and Intel for the current…
A: As per the accounting equation, Assets=Liabilities+Equity
Q: Vertical analysis Two income statements for Cornea Company follow: Cornea Company Income…
A: Vertical income statement used to compare the income statement of two or more periods. It is helpful…
Q: Bramble Company compiled the following financial information as of December 31, 2022: Revenues…
A:
Q: CommercialServices.com Corporation provides business-to-business services on the Internet. Data…
A: Return on investment (ROI): This financial ratio evaluates how efficiently the assets are used in…
Q: eBook Return on Total Assets A company reports the following income statement and balance sheet…
A: The Return on assets is calculated as operating income or EBIT divided by average total assets.
Q: escription Apple Or otal revenue $42,905,000 $23,25 larnings before C1206 000
A: Need to calculate the ROE and ROA ration Ratio analysis needs to be done for the provided…
Q: 1- Key Statistics: (OMIT ALL ZEROS 000); if none, leave blank Income Statement (2020) Current Year…
A: The consistent financial statement helps the management to compare their financial performance with…
Q: NIKE,INC Financial Statement Analysis The financial statements for Nike, Inc., are presented in…
A: Ratio analysis includes computing of ratios to compare them with different periods and with…
Q: Prepare a horizontal analysis of both the balance sheet and income statement. Complete this question…
A: Increase/(decrease) = Year 4 amount - Year 3 amount % change = Increase (decrease)/Year 3 amount
Q: Calculate Gillian Pool and Spa Supplies’ average annual compound growth rate of sales, and analyze…
A: Compound annual growth rate on sales measure the growth rate on sales over the specific time period.…
Q: Times interest earned Averill Products Inc. reported the following on the company’s income…
A: Solution:- a)Calculation of the times interest earned ratio for 20Y8 and 20Y9 as follows under:-…
Q: The following information is available for Advanced Micro Devices (AMD) and Intel for the current…
A: Accounting equation: Assets = Liabilities + Equity
Q: xtract of Balance sheet items as at 31 December 2020 OR Land 35000 Account receivables…
A: Formula: Owners equity = Capital + Retained earnings - Drawings. Deduction of drawings from Capital…
Q: Q3.CASE STUDY: SANJAY INDUSTRIES LTD. (Balance Sheet and Income Statement) The followingare the…
A: TRADING & PROFIT AND LOSS…
Q: Key comparative figures ($ millions) for both Apple and Google follow. Apple Google Key…
A: Return On Assets = Net Income / Average Assets Total Assets = Liabilities + equity. Average Assets…
Q: The following are recent year summeries of balance sheet and income statement data ( in millions)…
A: Stockholders' equity refers to the assets left in a corporation after all liabilities have been…
Q: Times interest earned A company reports the following: Income before income tax expense $4,300,000…
A: Solution: Income before Interest and income tax expense = Income before income tax expense +…
Q: Retained earnings, January 1, 2022 $87,100 Advertising expense 2,340 Dividends 7,800 Rent expense…
A: Net Income: The net income of the business is determined by subtracting the total expenses from the…
Q: 1,500,000 translation adjustment - credit What amount should be reported as shareholders' equity at…
A: solution concept shareholders equity includes the share capital , share premium and retained…
Q: Year Net Income Cumulative (Loss) Net Income 2018 6,500,000 6,500,000 2019 400,000
A: Cumulative net income = Net income for 2018 + Net income for 2019
How much are current-year expenses for (a) Apple and (b) Google?


Trending now
This is a popular solution!

Step by step
Solved in 2 steps with 2 images


- The total assets and total liabilities for a recent year of Apple (AAPL) and HP (HPQ) formerly Hewlett-Packard are shown below. Apple(in millions) HP(in millions) Assets $290,479 $103,206 Liabilities 171,124 76,475 Determine the stockholders' equity of each company. Apple $fill in the blank 1 million HP $fill in the blank 2 millionThe following information is available for Advanced Micro Devices (AMD) and Intel for the current year. • AMD’s assets increased by $1,205 million and its liabilities increased by $401 million.• Intel’s assets increased by $5,657 million and its liabilities decreased by $996 million. a. Complete the following table. Stockholders' Assets Assets Liabilities Liabilities equity $ millions Beg. of year End of year Beg. of year End of year End of year Advanced Micro Devices Answer $5,467 $3,547 Answer Answer Intel $147,899 Answer Answer $64,080 Answer b. Calculate average assets for each company. Round your answers to the nearest million, if applicable. $ millions Avg. Assets Advanced Micro Devices Answer Intel Answer c. Which company has the larger proportion of its assets financed by the company’s owners at year-end?AnswerAdvanced Micro DevicesIntel Please answer all parts of the question.The following information is available for Advanced Micro Devices (AMD) and Intel for the current year. • AMD’s assets increased by $1,205 million and its liabilities increased by $401 million.• Intel’s assets increased by $5,657 million and its liabilities decreased by $996 million. a. Complete the following table. Stockholders' Assets Assets Liabilities Liabilities equity $ millions Beg. of year End of year Beg. of year End of year End of year Advanced Micro Devices Answer $5,467 $3,547 Answer Answer Intel $147,899 Answer Answer $64,080 Answer
- SPREADSHEET DIRECTIONS: Apple Inc. wants to conduct a comparative Ratio Analysis of their last 2 years to reveal insight into their profitability, liquidity, solvency, and operational efficiency. Utilize the provided Ratios to complete the Analysis. Utilize the APPLE Income Statement, APPLE Balance Sheet, APPLE Cash Flow Statement Spreadsheets and the Ratio Equations to complete the missing colored cells. spreadsheet https://docs.google.com/spreadsheets/d/1PMxi_-pVCN3FvbeCZTQ7q9caeDtA1x1x/edit?usp=sharing&ouid=103368527338324517598&rtpof=true&sd=trueUsing the “Statement of Income” worksheet, center the financial statement titles across the data below and bold the company name Thom-Pierre Consultants (TPC) Quarterly Schedule of Revenue For the year December 31, 2018 QTR1 QTR2 QTR3 QTR4 2018 Sales 290000 320000 320000 490000 1,420,000 Interest 102500 175000 180000 54000 511,500 Investment Income 13000 9500 10000 20000 52,500 Other 16000 25000 19500 29000 89,500 Total 421,500 529,500 529,500 593,000 2,073,500 Thom-Pierre Consultants (TPC) COMPARITIVE INCOME STATEMENT for years ended 31 December 2018 2019 Revenues and gains *Sales revenue *Interest revenue *Investment Income *Other revenue Total revenue and gains Expenses and losses **Cost of goods sold 460,000 **Selling…The following information is available for Advanced Micro Devices (AMD) and Intel for the current year. • AMD’s assets increased by $803 million and its liabilities increased by $267 million.• Intel’s assets increased by $3,771 million and its liabilities decreased by $664 million. a. Complete the following table. Stockholders' Assets Assets Liabilities Liabilities equity $ millions Beg. of year End of year Beg. of year End of year End of year Advanced Micro Devices Answer $3,645 $2,365 Answer Answer Intel $98,599 Answer Answer $42,720 Answer b. Calculate average assets for each company. Round your answers to the nearest million, if applicable. $ millions Avg. Assets Advanced Micro Devices Answer Intel Answer c. Which company has the larger proportion of its assets financed by the company’s owners at year-end?
- I was given only this document for an assignment: What is the Fiscal Year End Date?Amazon: December 31st, 2019Walmart: January 31st, 2020Financial Statements data:Amazon:Net Sales: $280,522,000,000Basic net income per common share: $23.46Total current assets: $96,334,000,000Retained earnings: $31,220,000,000Net cash provided by operating activities: $38,514,000,000Inventory LIFOWalmart:Net Sales: $519,926,000,000Basic net income per common share: $5.22Total current assets: $61,806,000,000Retained earnings: $83,943,000,000Net cash provided by operating activities: $25,255,000,000Inventory: FIFO ANSWER THE FOLLOWING QUESTIONS:What are 3 differences between accounting policies from each company and why do you think they are different? I'm not sure exactly what the 3 differences are. I believe (1) is the fiscal year versus the calendar year ending maybe due to Walmart having more seasonal sales like Christmas, and (2) is the FIFO vs LIFO method - but I'm not sure why they would choose…What is Yahoo’s common-sized product development expense for 2017? (Rounded to two decimal places, in percentage format). $ in millions Dec 31, 2017 Dec 31, 2016 Total Assets $17,103.30 $16,805.00 Revenues 4,984.20 4,986.60 Product development exp 919.40 885.80 Operating Expense 3,102.00 3,007.80 Net Income $1,048.80 $1,093.00Question: Calculate the average annual growth rate of Microsoft from the fiscal year ending 2009 until the fiscal year ending. EBIT 2009 - 2019: 2019 2018 2017 2016 2015 2014 2013 2012 2011 2010 2009 42,933,000 35,011,000 31,315,000 26,236,000 20,489,000 27,780,000 26,556,000 21,763,000 27,161,000 24,157,000 20,363,000 Is 9.34% correct?
- SEARCH ASK CHAT MATH SOLVER Question Selected information from the 2018 and 2017 financial statements of Super Ratio Corporation is presented below: As of December 31 2018 2017 Cash $ 21,000 $ 35,000 Marketable securities (current) 27,000 22,000 Accounts receivable (net) 60,000 98,000 Inventory 105,000 142,000 Prepaid expenses 5,000 3,000 Land and building (net) 247,000 315,000 Accounts payable 57,000 75,000 Accrued expenses 10,000 14,000 Notes payable (short-term) 8,000 4,000 Bonds payable (due in three years) 52,000 66,000 As of December 31 2018 2017 Cash sales $750,000 $675,000 Credit sales (percent of cash sales) 82% 85% Cost of goods sold (percent of total sales) 60% 58% Net income $30,000 $38,000 Interest expense 6,000 9,000 Income…The following are recent year summeries of balance sheet and income statement data ( in millions) for Apple Inc.(AAPL) and Verizon Commucations(VZ).Begin by calculating the gross profit for each year, then prepare a horizontal analysis of revenues and gross profitlong dash—both in dollar amounts and in percentageslong dash—for 20192019 and 20182018. (Enter amounts in millions as provided to you in the problem statement. Round the percentages to one decimal place, X.X%. Use a minus sign or parentheses to indicate a decrease.) McDonald Corp. Income Statement - (Partial) Years Ended December 31, 2019 and 2018 (Amounts in millions) 2019 2018 2017 Revenues $9,575 $9,300 $8,975 Cost of Goods Sold 6,250 6,000 5,890 Gross Profit
