Dr. Kijowski is concerned about student phone use, so she collects information on the number of text messages that each student sent on a particular day. The boxplot below shows the results. Based on the boxplot, which of the following is the most reasonable conclusion? a. There are more people with data values below the median than there are people with data values above the median. Selected:b. There are more people with data values between the first quartile and the median than there are people with data values between the median and the third quartile.This answer is incorrect. c. There are fewer people with data values between the first quartile and the median than there are people with data values between the median and the third quartile. d. There are approximately the same number of people with data values between the first quartile and the minimum as there are people with data values between the third quartile and the maximum. e. The data are less spread out between the first quartile and the median than between the median and the third quartile.
Dr. Kijowski is concerned about student phone use, so she collects information on the number of text messages that each student sent on a particular day. The boxplot below shows the results. Based on the boxplot, which of the following is the most reasonable conclusion? a. There are more people with data values below the median than there are people with data values above the median. Selected:b. There are more people with data values between the first quartile and the median than there are people with data values between the median and the third quartile.This answer is incorrect. c. There are fewer people with data values between the first quartile and the median than there are people with data values between the median and the third quartile. d. There are approximately the same number of people with data values between the first quartile and the minimum as there are people with data values between the third quartile and the maximum. e. The data are less spread out between the first quartile and the median than between the median and the third quartile.

Holt Mcdougal Larson Pre-algebra: Student Edition 2012
1st Edition
ISBN:9780547587776
Author:HOLT MCDOUGAL
Publisher:HOLT MCDOUGAL
ChapterCSR: Contents Of Student Resources
Section: Chapter Questions
Problem 4.10P

Related questions
Topic Video
Question
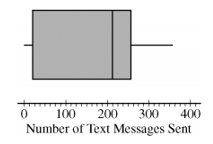
Dr. Kijowski is concerned about student phone use, so she collects information on the number of text messages that each student sent on a particular day. The boxplot below shows the results.
Based on the boxplot, which of the following is the most reasonable conclusion?
- a. There are more people with data values below the median than there are people with data values above the median.
- Selected:b. There are more people with data values between the first
quartile and the median than there are people with data values between the median and the third quartile.This answer is incorrect. - c. There are fewer people with data values between the first quartile and the median than there are people with data values between the median and the third quartile.
- d. There are approximately the same number of people with data values between the first quartile and the minimum as there are people with data values between the third quartile and the maximum.
- e. The data are less spread out between the first quartile and the median than between the median and the third quartile.
Transcribed Image Text:100
Number of Text Messages Sent
200
300
400
Expert Solution
This question has been solved!
Explore an expertly crafted, step-by-step solution for a thorough understanding of key concepts.

This is a popular solution!

Trending now
This is a popular solution!

Step by step
Solved in 2 steps

Knowledge Booster


Learn more about
Need a deep-dive on the concept behind this application? Look no further. Learn more about this topic, statistics and related others by exploring similar questions and additional content below.Recommended textbooks for you
Holt Mcdougal Larson Pre-algebra: Student Edition…
Algebra
ISBN:
9780547587776
Author:
HOLT MCDOUGAL
Publisher:
HOLT MCDOUGAL

Elementary Algebra
Algebra
ISBN:
9780998625713
Author:
Lynn Marecek, MaryAnne Anthony-Smith
Publisher:
OpenStax - Rice University

Algebra: Structure And Method, Book 1
Algebra
ISBN:
9780395977224
Author:
Richard G. Brown, Mary P. Dolciani, Robert H. Sorgenfrey, William L. Cole
Publisher:
McDougal Littell
Holt Mcdougal Larson Pre-algebra: Student Edition…
Algebra
ISBN:
9780547587776
Author:
HOLT MCDOUGAL
Publisher:
HOLT MCDOUGAL
Elementary Algebra
Algebra
ISBN:
9780998625713
Author:
Lynn Marecek, MaryAnne Anthony-Smith
Publisher:
OpenStax - Rice University
Algebra: Structure And Method, Book 1
Algebra
ISBN:
9780395977224
Author:
Richard G. Brown, Mary P. Dolciani, Robert H. Sorgenfrey, William L. Cole
Publisher:
McDougal Littell

Mathematics For Machine Technology
Advanced Math
ISBN:
9781337798310
Author:
Peterson, John.
Publisher:
Cengage Learning,