Lab 3: Concentrations/Standard Curve Lab Data and Questions Activity 3: MAKING DILUTIONS AND STANDARD CURVE Final concentration of BSA (bovine serum albumin) (ug/ml) 2000ug/ml Tube Abs595nm measured by spectrophotometer 1 0.541 1000ug/ml 0.423 3. 500ug/ml 0.247 4 250ug/ml O.160 Graph 1: Plot a standard curve of Absorbance (A) vs. concentration of BSA (ug/ml) in the graph below. Draw a best fit line. You will use this graph for Activity 4. Be sure to label your axis. (200 (250 e. (a50, 0A60 01 a50 1. What is the equation of the best fit line for the graph above? 500 2000 1000 Concentrition of BS Absorbance (A)
Lab 3: Concentrations/Standard Curve Lab Data and Questions Activity 3: MAKING DILUTIONS AND STANDARD CURVE Final concentration of BSA (bovine serum albumin) (ug/ml) 2000ug/ml Tube Abs595nm measured by spectrophotometer 1 0.541 1000ug/ml 0.423 3. 500ug/ml 0.247 4 250ug/ml O.160 Graph 1: Plot a standard curve of Absorbance (A) vs. concentration of BSA (ug/ml) in the graph below. Draw a best fit line. You will use this graph for Activity 4. Be sure to label your axis. (200 (250 e. (a50, 0A60 01 a50 1. What is the equation of the best fit line for the graph above? 500 2000 1000 Concentrition of BS Absorbance (A)

Chapter14: Formula Method
Section: Chapter Questions
Problem 34SST

Related questions
Question
What is the equation of the best fit line for the graph above
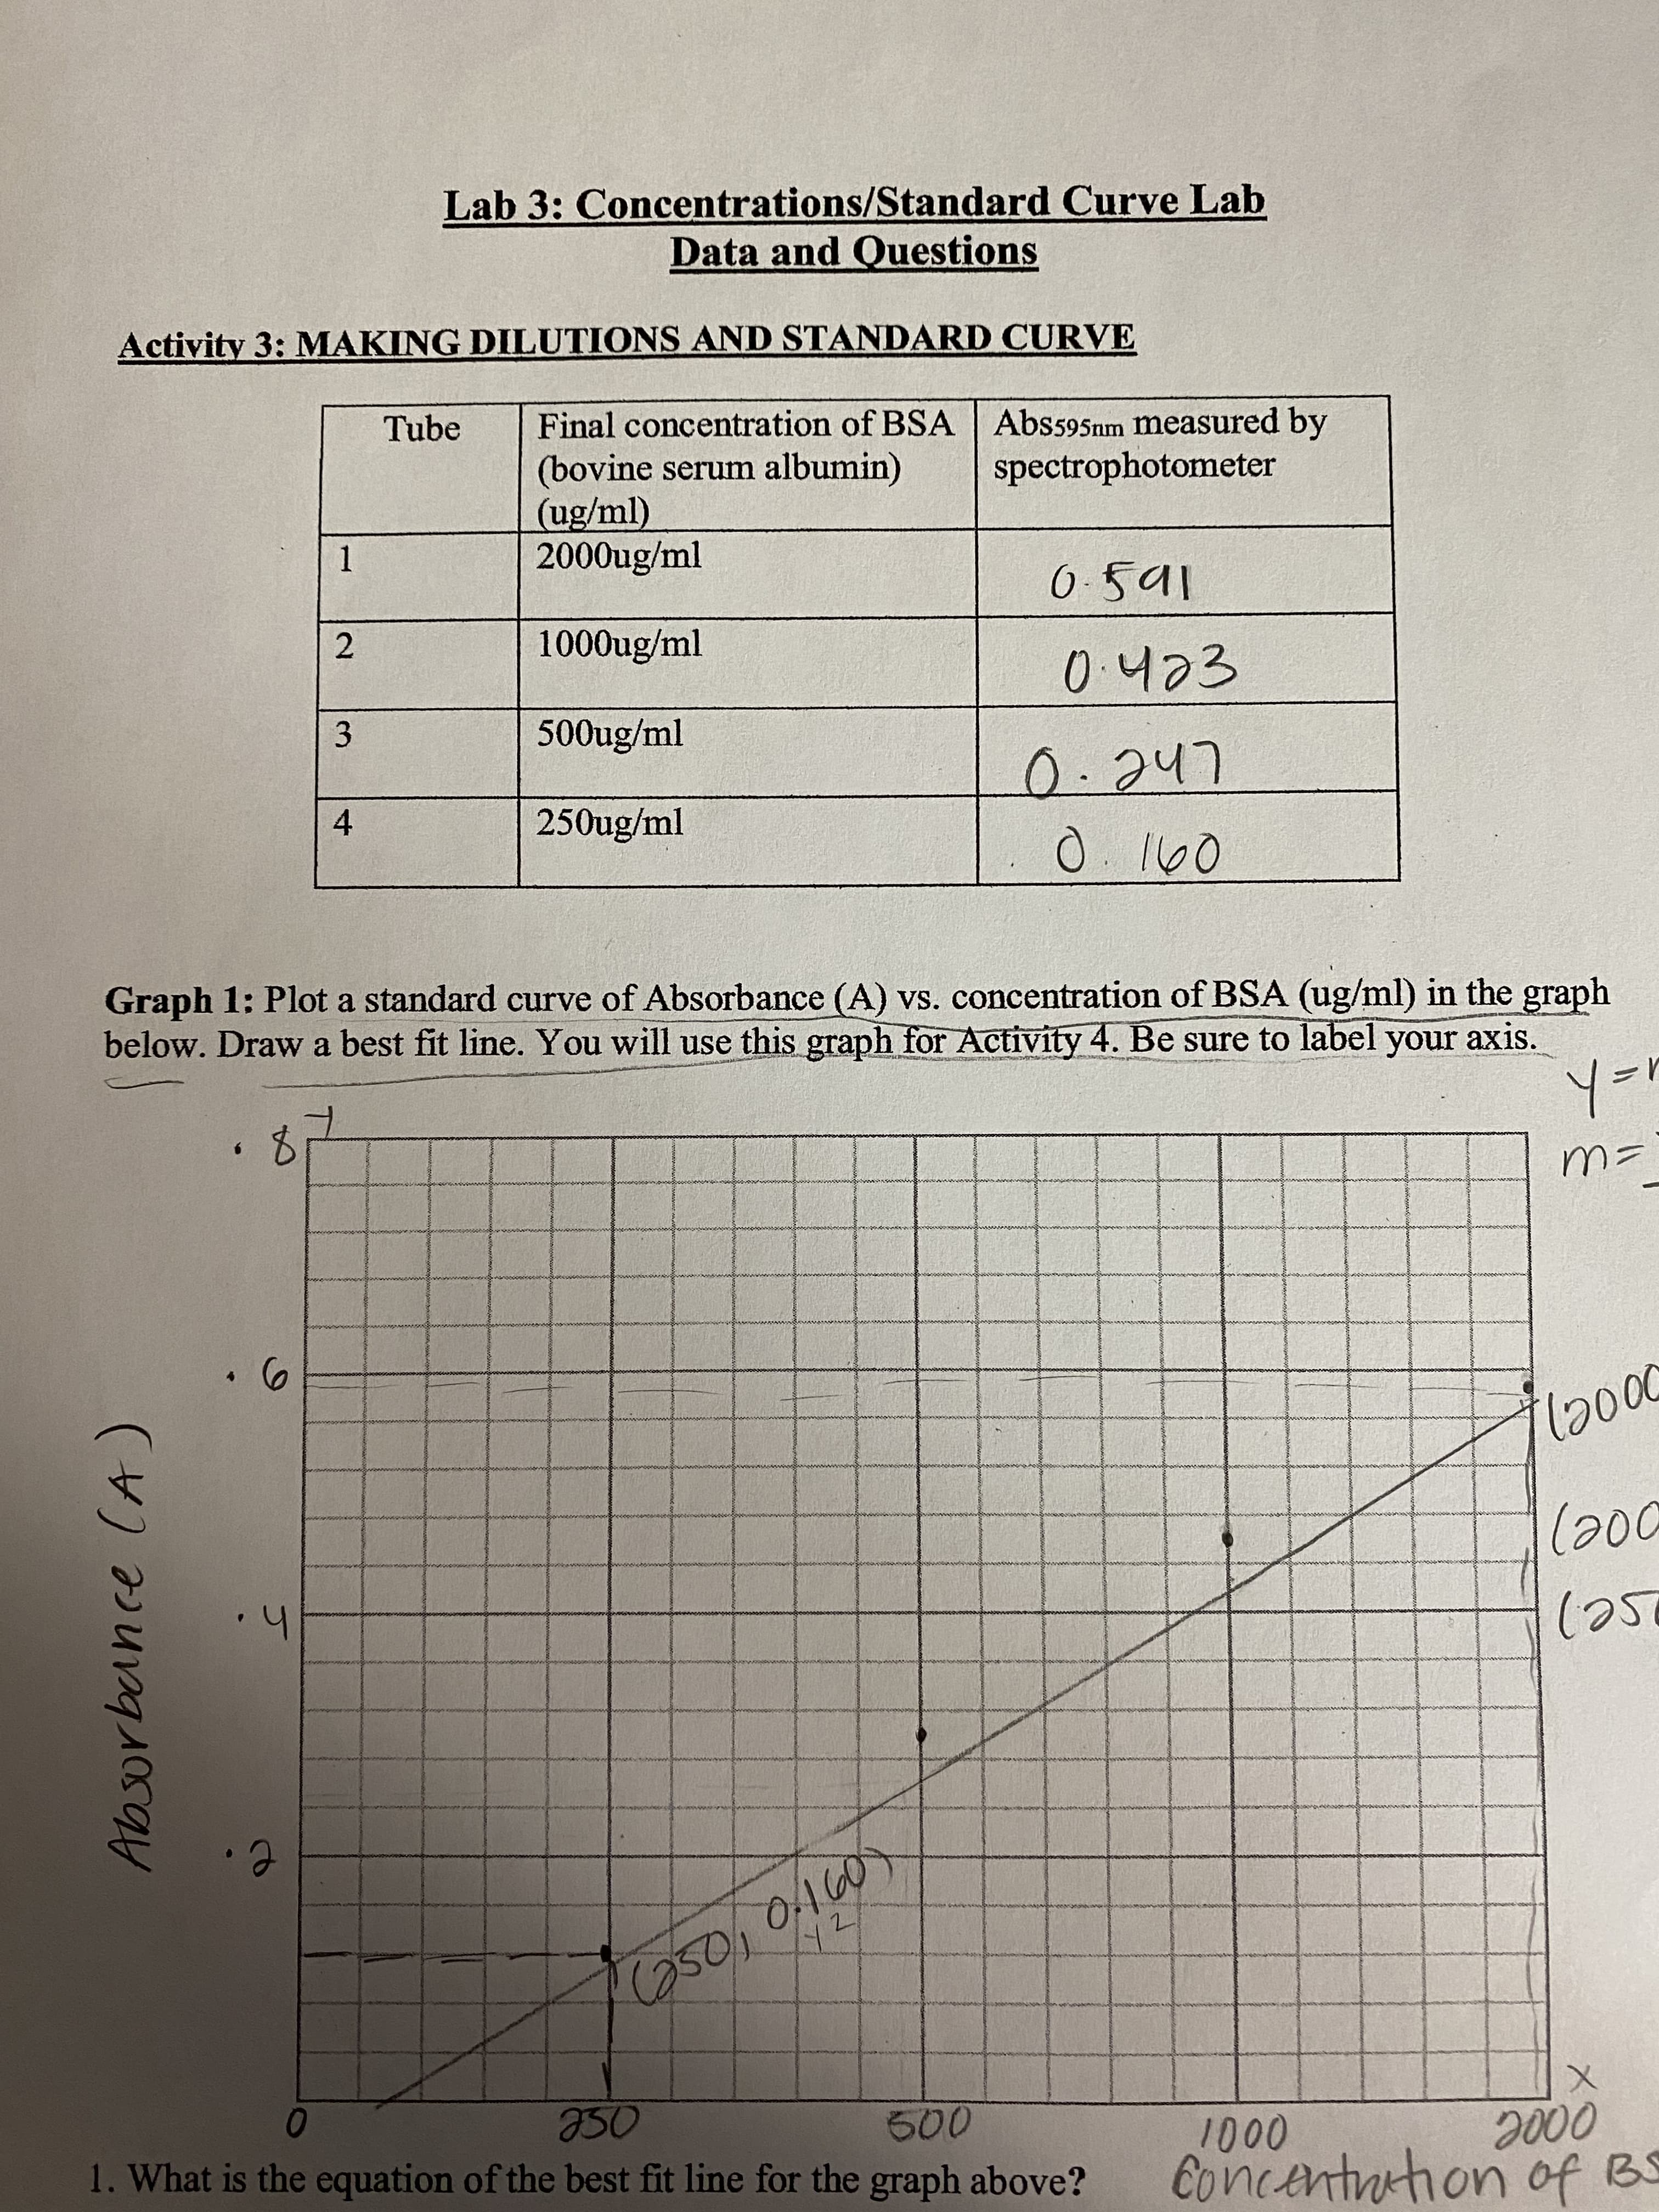
Transcribed Image Text:Lab 3: Concentrations/Standard Curve Lab
Data and Questions
Activity 3: MAKING DILUTIONS AND STANDARD CURVE
Final concentration of BSA
(bovine serum albumin)
(ug/ml)
2000ug/ml
Tube
Abs595nm measured by
spectrophotometer
1
0.541
1000ug/ml
0.423
3.
500ug/ml
0.247
4
250ug/ml
O.160
Graph 1: Plot a standard curve of Absorbance (A) vs. concentration of BSA (ug/ml) in the graph
below. Draw a best fit line. You will use this graph for Activity 4. Be sure to label your axis.
(200
(250
e.
(a50, 0A60
01
a50
1. What is the equation of the best fit line for the graph above?
500
2000
1000
Concentrition of BS
Absorbance (A)
Expert Solution
This question has been solved!
Explore an expertly crafted, step-by-step solution for a thorough understanding of key concepts.

This is a popular solution!

Trending now
This is a popular solution!

Step by step
Solved in 6 steps with 3 images

Knowledge Booster


Learn more about
Need a deep-dive on the concept behind this application? Look no further. Learn more about this topic, biology and related others by exploring similar questions and additional content below.Recommended textbooks for you

Cardiopulmonary Anatomy & Physiology
Biology
ISBN:
9781337794909
Author:
Des Jardins, Terry.
Publisher:
Cengage Learning,
Cardiopulmonary Anatomy & Physiology
Biology
ISBN:
9781337794909
Author:
Des Jardins, Terry.
Publisher:
Cengage Learning,

Principles Of Radiographic Imaging: An Art And A …
Health & Nutrition
ISBN:
9781337711067
Author:
Richard R. Carlton, Arlene M. Adler, Vesna Balac
Publisher:
Cengage Learning