Last school the student body of a local university consisted of 30% freshmen, 24% sophomores, year, 26% juniors, and 20% seniors. A sample of 300 students taken from this year's student body showed th following number of students in each classification. Freshmen 83 Sophomores 68 Juniors 85 Seniors 64 We are interested in determining whether or not there has been a significant change in the classifications between the last school year and this school year. Refer to Exhibit 11-2. The hypothesis is to be tested at the 5% level of significance. The critical value from the table equals O a. 7.815 ОБ.1.645 О с. 2.75
Last school the student body of a local university consisted of 30% freshmen, 24% sophomores, year, 26% juniors, and 20% seniors. A sample of 300 students taken from this year's student body showed th following number of students in each classification. Freshmen 83 Sophomores 68 Juniors 85 Seniors 64 We are interested in determining whether or not there has been a significant change in the classifications between the last school year and this school year. Refer to Exhibit 11-2. The hypothesis is to be tested at the 5% level of significance. The critical value from the table equals O a. 7.815 ОБ.1.645 О с. 2.75

Glencoe Algebra 1, Student Edition, 9780079039897, 0079039898, 2018
18th Edition
ISBN:9780079039897
Author:Carter
Publisher:Carter
Chapter10: Statistics
Section10.6: Summarizing Categorical Data
Problem 21PPS

Related questions

Concept explainers
Contingency Table
A contingency table can be defined as the visual representation of the relationship between two or more categorical variables that can be evaluated and registered. It is a categorical version of the scatterplot, which is used to investigate the linear relationship between two variables. A contingency table is indeed a type of frequency distribution table that displays two variables at the same time.
Binomial Distribution
Binomial is an algebraic expression of the sum or the difference of two terms. Before knowing about binomial distribution, we must know about the binomial theorem.
Topic Video
Question
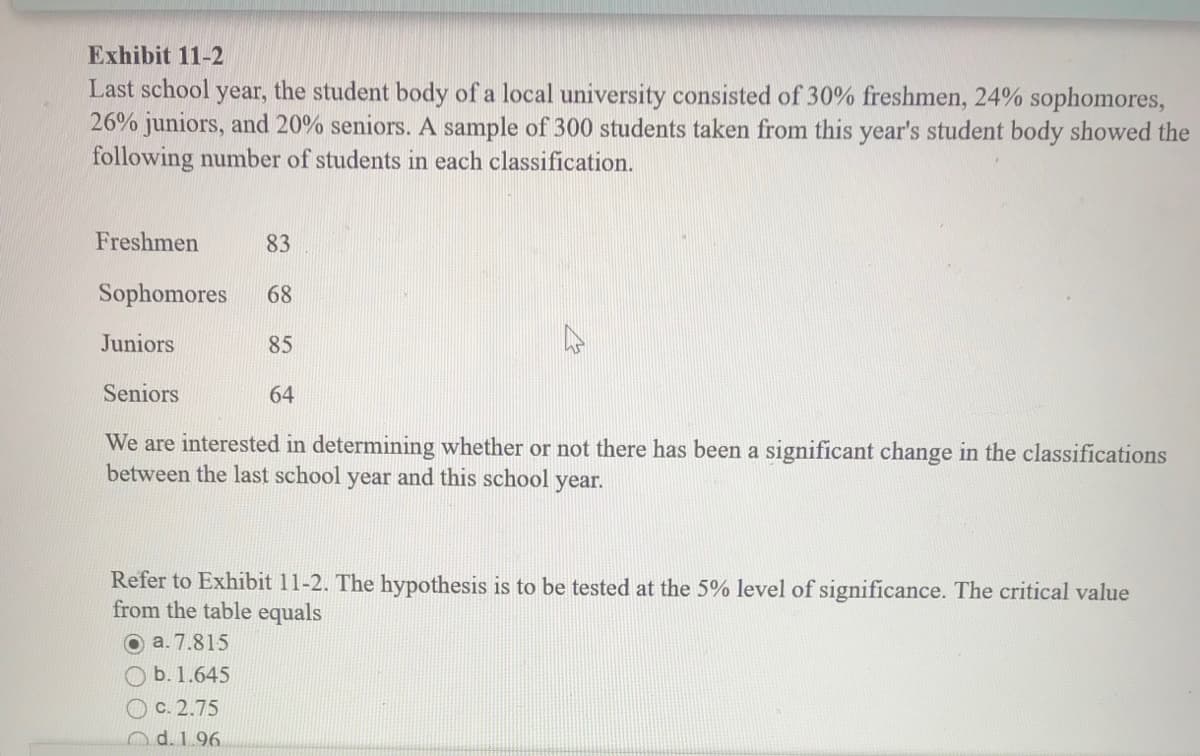
Transcribed Image Text:Exhibit 11-2
Last school year, the student body of a local university consisted of 30% freshmen, 24% sophomores,
26% juniors, and 20% seniors. A sample of 300 students taken from this year's student body showed the
following number of students in each classification.
Freshmen
83
Sophomores
68
Juniors
85
Seniors
64
We are interested in determining whether or not there has been a significant change in the classifications
between the last school year and this school year.
Refer to Exhibit 11-2. The hypothesis is to be tested at the 5% level of significance. The critical value
from the table equals
О а.7.815
b. 1.645
с. 2.75
n d.1.96.
Expert Solution
This question has been solved!
Explore an expertly crafted, step-by-step solution for a thorough understanding of key concepts.

This is a popular solution!

Trending now
This is a popular solution!

Step by step
Solved in 2 steps

Knowledge Booster


Learn more about
Need a deep-dive on the concept behind this application? Look no further. Learn more about this topic, statistics and related others by exploring similar questions and additional content below.Recommended textbooks for you
Glencoe Algebra 1, Student Edition, 9780079039897…
Algebra
ISBN:
9780079039897
Author:
Carter
Publisher:
McGraw Hill

Holt Mcdougal Larson Pre-algebra: Student Edition…
Algebra
ISBN:
9780547587776
Author:
HOLT MCDOUGAL
Publisher:
HOLT MCDOUGAL
Glencoe Algebra 1, Student Edition, 9780079039897…
Algebra
ISBN:
9780079039897
Author:
Carter
Publisher:
McGraw Hill
Holt Mcdougal Larson Pre-algebra: Student Edition…
Algebra
ISBN:
9780547587776
Author:
HOLT MCDOUGAL
Publisher:
HOLT MCDOUGAL