lenovo Stati X + books/9780357118191/cfi/475!/4/4@0.00:10.6 I Cmarie II your arca spend on child care per week differs from the reported mean of 6.4 hours per week. A sample of 40 married couples will be used with the data collected showing the hours per week the husband spends on child care. The sample data are contained in the file ChildCare. a. What are the hypotheses if your group would like to determine if the population mean number of hours married men are spending in child care differs from the mean reported by Time in your area? b. What is the sample mean and the p-value? c. Select your own level of significance. What 31. Chocolate Consumption. The United States ranks ninth in the world in per capita chocolate consumption; Forbes reports that the average American eats 9.5 pounds of chocolate annually. Suppose you are curious whether chocolate consumption is higher in Hershey, Pennsylvania, the location of the Hershey Company's corporate headquarters. A sample of 36 individuals from the Hershey area showeda sample mean annual consumption of 10.05 pounds and a standard deviation of s 1.5 pounds. Using a = annual consumption of chocolate is higher in Hershey than it is throughout the your conclusion? .05, do the sample results support the conclusion that mean 32. Used Car Prices. According to the National Automobile Dealers Association, the mean price for used cars is $10,192. A manager of a Kansas City used car dealer- ship reviewed a sample of 50 recent used car sales at the dealership in an attempt to determine whether the population mean price for used cars at this particular dealership differed from the national mean. The prices for the sample of 50 cars are shown in the file UsedCars. United States? a. Formulate the hypotheses that can be used to determine whether a difference exists in the mean price for used cars at the dealership. b. What is the p-value? We've updat Gi 中 Aa 23 e
lenovo Stati X + books/9780357118191/cfi/475!/4/4@0.00:10.6 I Cmarie II your arca spend on child care per week differs from the reported mean of 6.4 hours per week. A sample of 40 married couples will be used with the data collected showing the hours per week the husband spends on child care. The sample data are contained in the file ChildCare. a. What are the hypotheses if your group would like to determine if the population mean number of hours married men are spending in child care differs from the mean reported by Time in your area? b. What is the sample mean and the p-value? c. Select your own level of significance. What 31. Chocolate Consumption. The United States ranks ninth in the world in per capita chocolate consumption; Forbes reports that the average American eats 9.5 pounds of chocolate annually. Suppose you are curious whether chocolate consumption is higher in Hershey, Pennsylvania, the location of the Hershey Company's corporate headquarters. A sample of 36 individuals from the Hershey area showeda sample mean annual consumption of 10.05 pounds and a standard deviation of s 1.5 pounds. Using a = annual consumption of chocolate is higher in Hershey than it is throughout the your conclusion? .05, do the sample results support the conclusion that mean 32. Used Car Prices. According to the National Automobile Dealers Association, the mean price for used cars is $10,192. A manager of a Kansas City used car dealer- ship reviewed a sample of 50 recent used car sales at the dealership in an attempt to determine whether the population mean price for used cars at this particular dealership differed from the national mean. The prices for the sample of 50 cars are shown in the file UsedCars. United States? a. Formulate the hypotheses that can be used to determine whether a difference exists in the mean price for used cars at the dealership. b. What is the p-value? We've updat Gi 中 Aa 23 e

MATLAB: An Introduction with Applications
6th Edition
ISBN:9781119256830
Author:Amos Gilat
Publisher:Amos Gilat
Chapter1: Starting With Matlab
Section: Chapter Questions
Problem 1P

Related questions

Concept explainers
Contingency Table
A contingency table can be defined as the visual representation of the relationship between two or more categorical variables that can be evaluated and registered. It is a categorical version of the scatterplot, which is used to investigate the linear relationship between two variables. A contingency table is indeed a type of frequency distribution table that displays two variables at the same time.
Binomial Distribution
Binomial is an algebraic expression of the sum or the difference of two terms. Before knowing about binomial distribution, we must know about the binomial theorem.
Topic Video
Question
Problem 31
Transcribed Image Text:lenovo
Stati X
+
books/9780357118191/cfi/475!/4/4@0.00:10.6
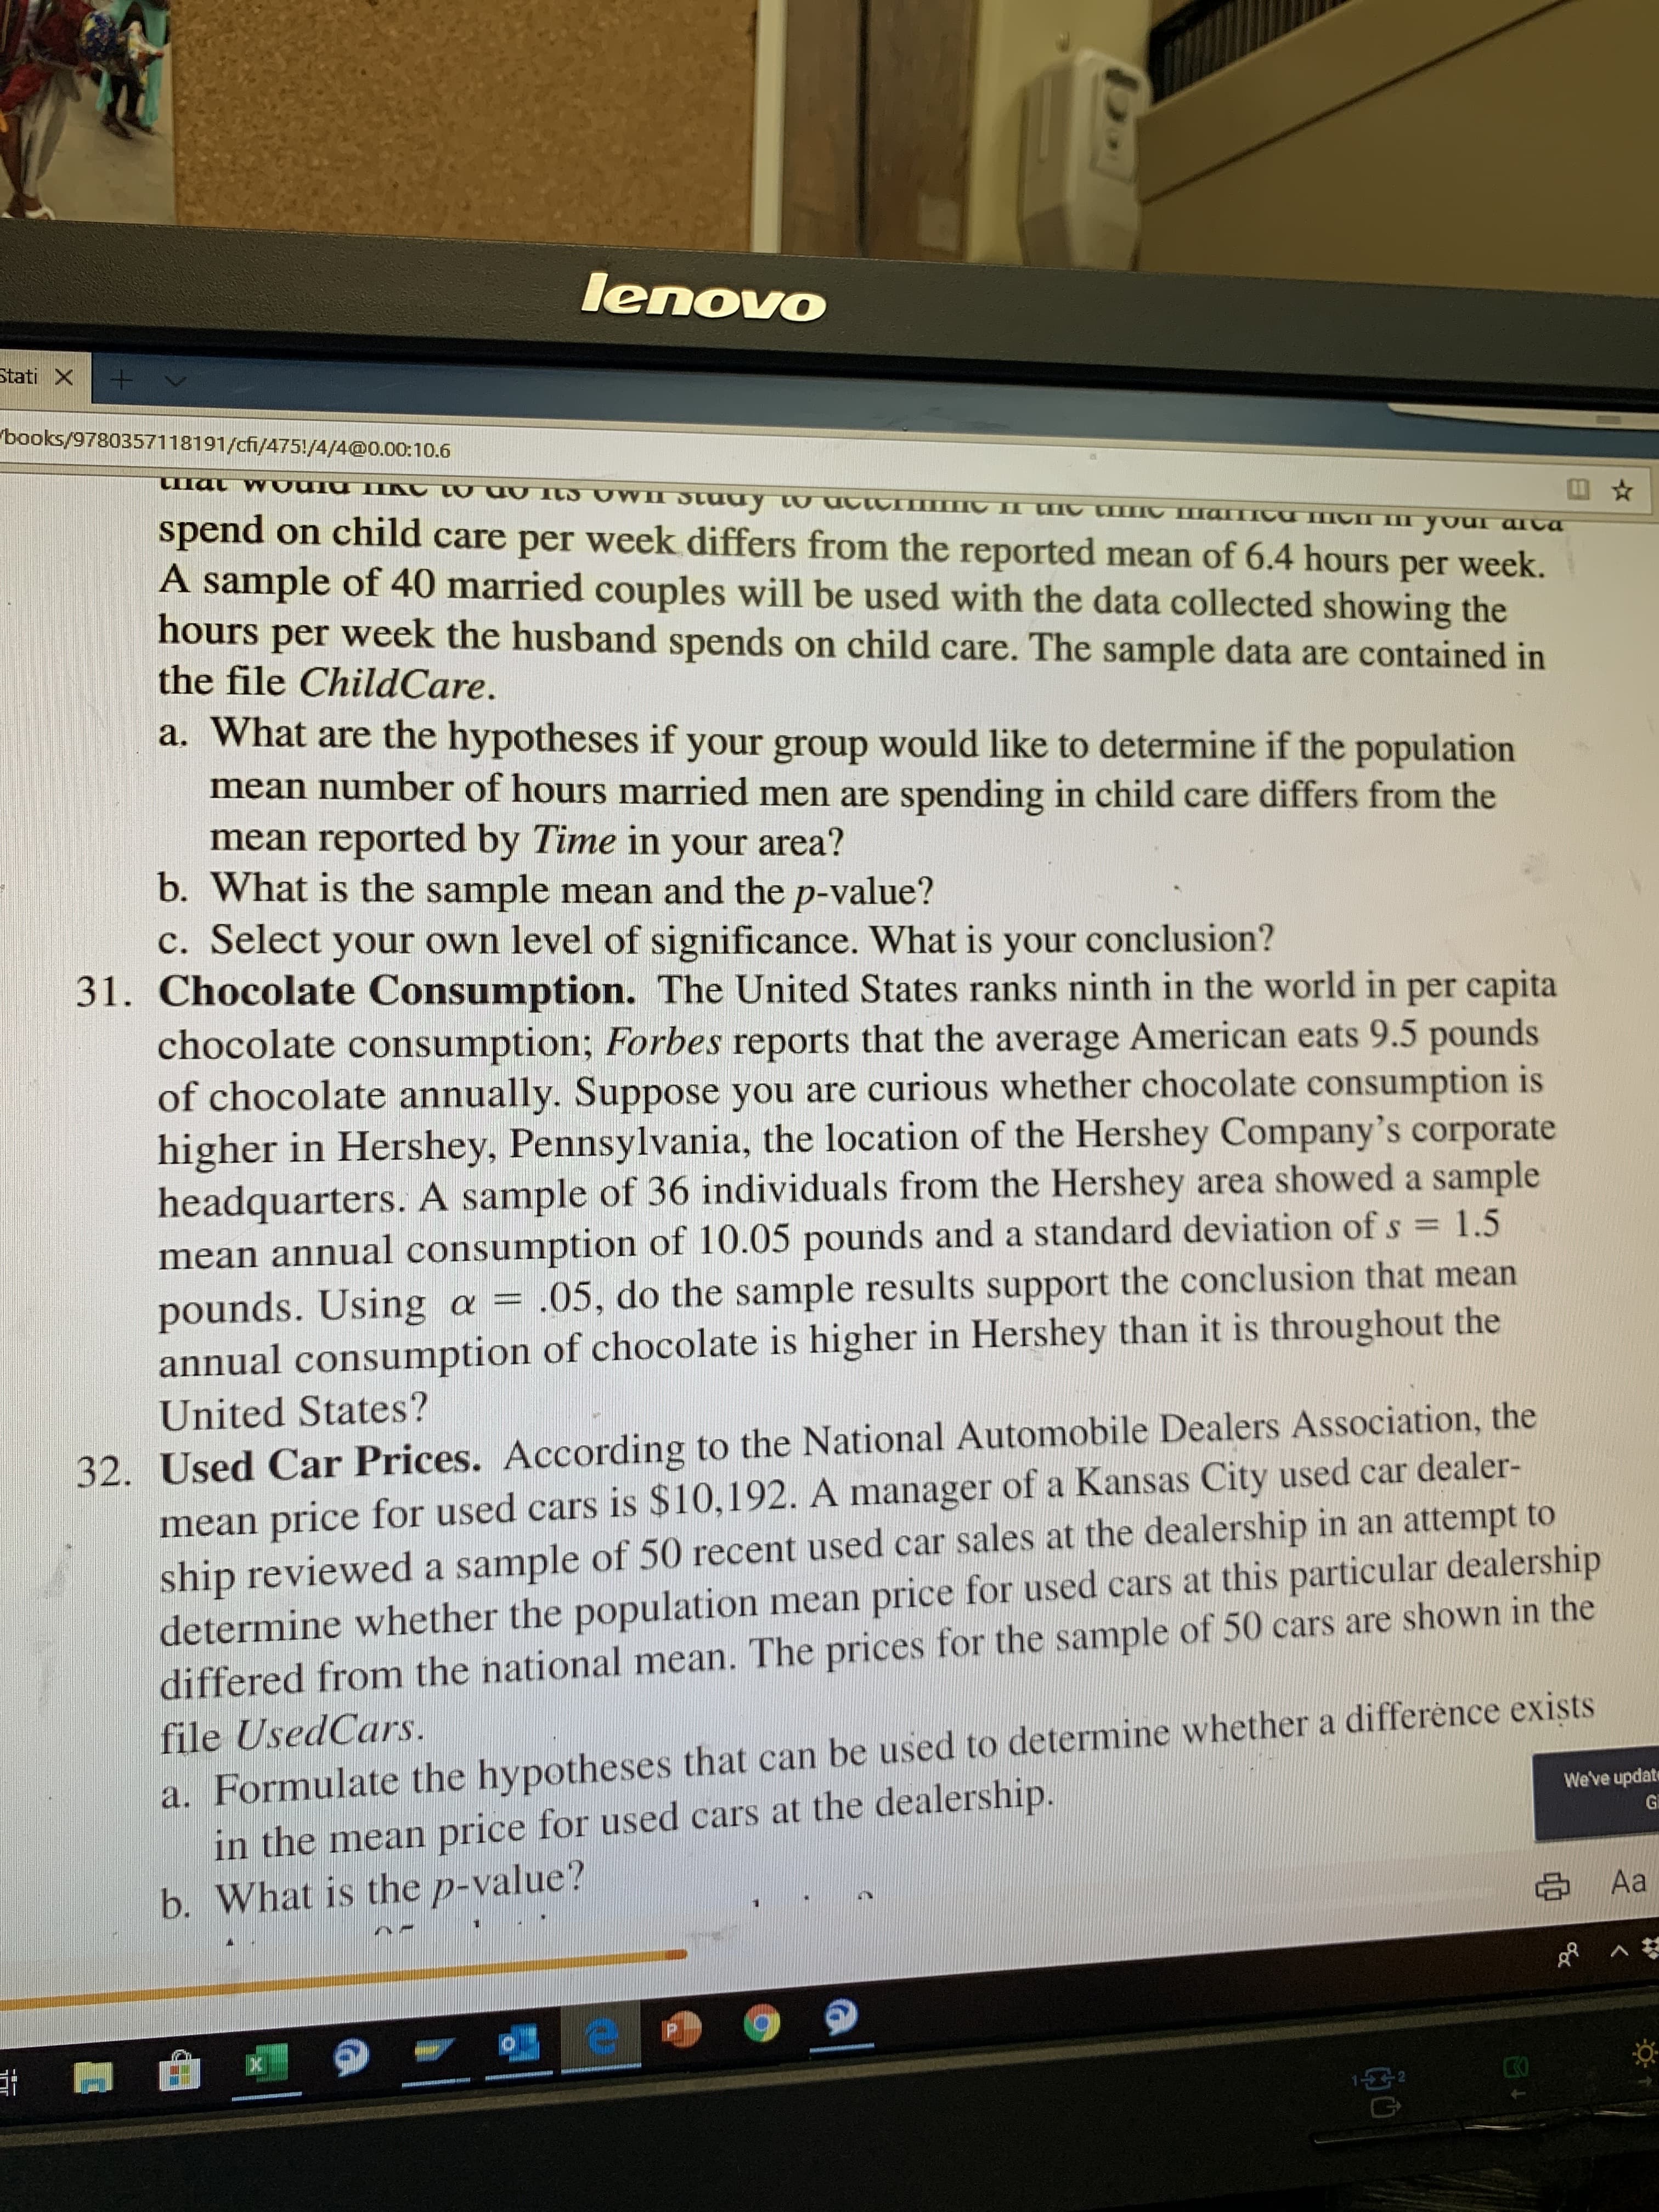
I Cmarie II your arca
spend on child care per week differs from the reported mean of 6.4 hours per week.
A sample of 40 married couples will be used with the data collected showing the
hours per week the husband spends on child care. The sample data are contained in
the file ChildCare.
a. What are the hypotheses if your group would like to determine if the population
mean number of hours married men are spending in child care differs from the
mean reported by Time in your area?
b. What is the sample mean and the p-value?
c. Select your own level of significance. What
31. Chocolate Consumption. The United States ranks ninth in the world in per capita
chocolate consumption; Forbes reports that the average American eats 9.5 pounds
of chocolate annually. Suppose you are curious whether chocolate consumption is
higher in Hershey, Pennsylvania, the location of the Hershey Company's corporate
headquarters. A sample of 36 individuals from the Hershey area showeda sample
mean annual consumption of 10.05 pounds and a standard deviation of s 1.5
pounds. Using a =
annual consumption of chocolate is higher in Hershey than it is throughout the
your conclusion?
.05, do the sample results support the conclusion that mean
32. Used Car Prices. According to the National Automobile Dealers Association, the
mean price for used cars is $10,192. A manager of a Kansas City used car dealer-
ship reviewed a sample of 50 recent used car sales at the dealership in an attempt to
determine whether the population mean price for used cars at this particular dealership
differed from the national mean. The prices for the sample of 50 cars are shown in the
file UsedCars.
United States?
a. Formulate the hypotheses that can be used to determine whether a difference exists
in the mean price for used cars at the dealership.
b. What is the p-value?
We've updat
Gi
中 Aa
23
e
Expert Solution
This question has been solved!
Explore an expertly crafted, step-by-step solution for a thorough understanding of key concepts.

This is a popular solution!

Trending now
This is a popular solution!

Step by step
Solved in 3 steps with 2 images

Knowledge Booster


Learn more about
Need a deep-dive on the concept behind this application? Look no further. Learn more about this topic, statistics and related others by exploring similar questions and additional content below.Recommended textbooks for you
MATLAB: An Introduction with Applications
Statistics
ISBN:
9781119256830
Author:
Amos Gilat
Publisher:
John Wiley & Sons Inc

Probability and Statistics for Engineering and th…
Statistics
ISBN:
9781305251809
Author:
Jay L. Devore
Publisher:
Cengage Learning

Statistics for The Behavioral Sciences (MindTap C…
Statistics
ISBN:
9781305504912
Author:
Frederick J Gravetter, Larry B. Wallnau
Publisher:
Cengage Learning
MATLAB: An Introduction with Applications
Statistics
ISBN:
9781119256830
Author:
Amos Gilat
Publisher:
John Wiley & Sons Inc
Probability and Statistics for Engineering and th…
Statistics
ISBN:
9781305251809
Author:
Jay L. Devore
Publisher:
Cengage Learning
Statistics for The Behavioral Sciences (MindTap C…
Statistics
ISBN:
9781305504912
Author:
Frederick J Gravetter, Larry B. Wallnau
Publisher:
Cengage Learning

Elementary Statistics: Picturing the World (7th E…
Statistics
ISBN:
9780134683416
Author:
Ron Larson, Betsy Farber
Publisher:
PEARSON

The Basic Practice of Statistics
Statistics
ISBN:
9781319042578
Author:
David S. Moore, William I. Notz, Michael A. Fligner
Publisher:
W. H. Freeman

Introduction to the Practice of Statistics
Statistics
ISBN:
9781319013387
Author:
David S. Moore, George P. McCabe, Bruce A. Craig
Publisher:
W. H. Freeman