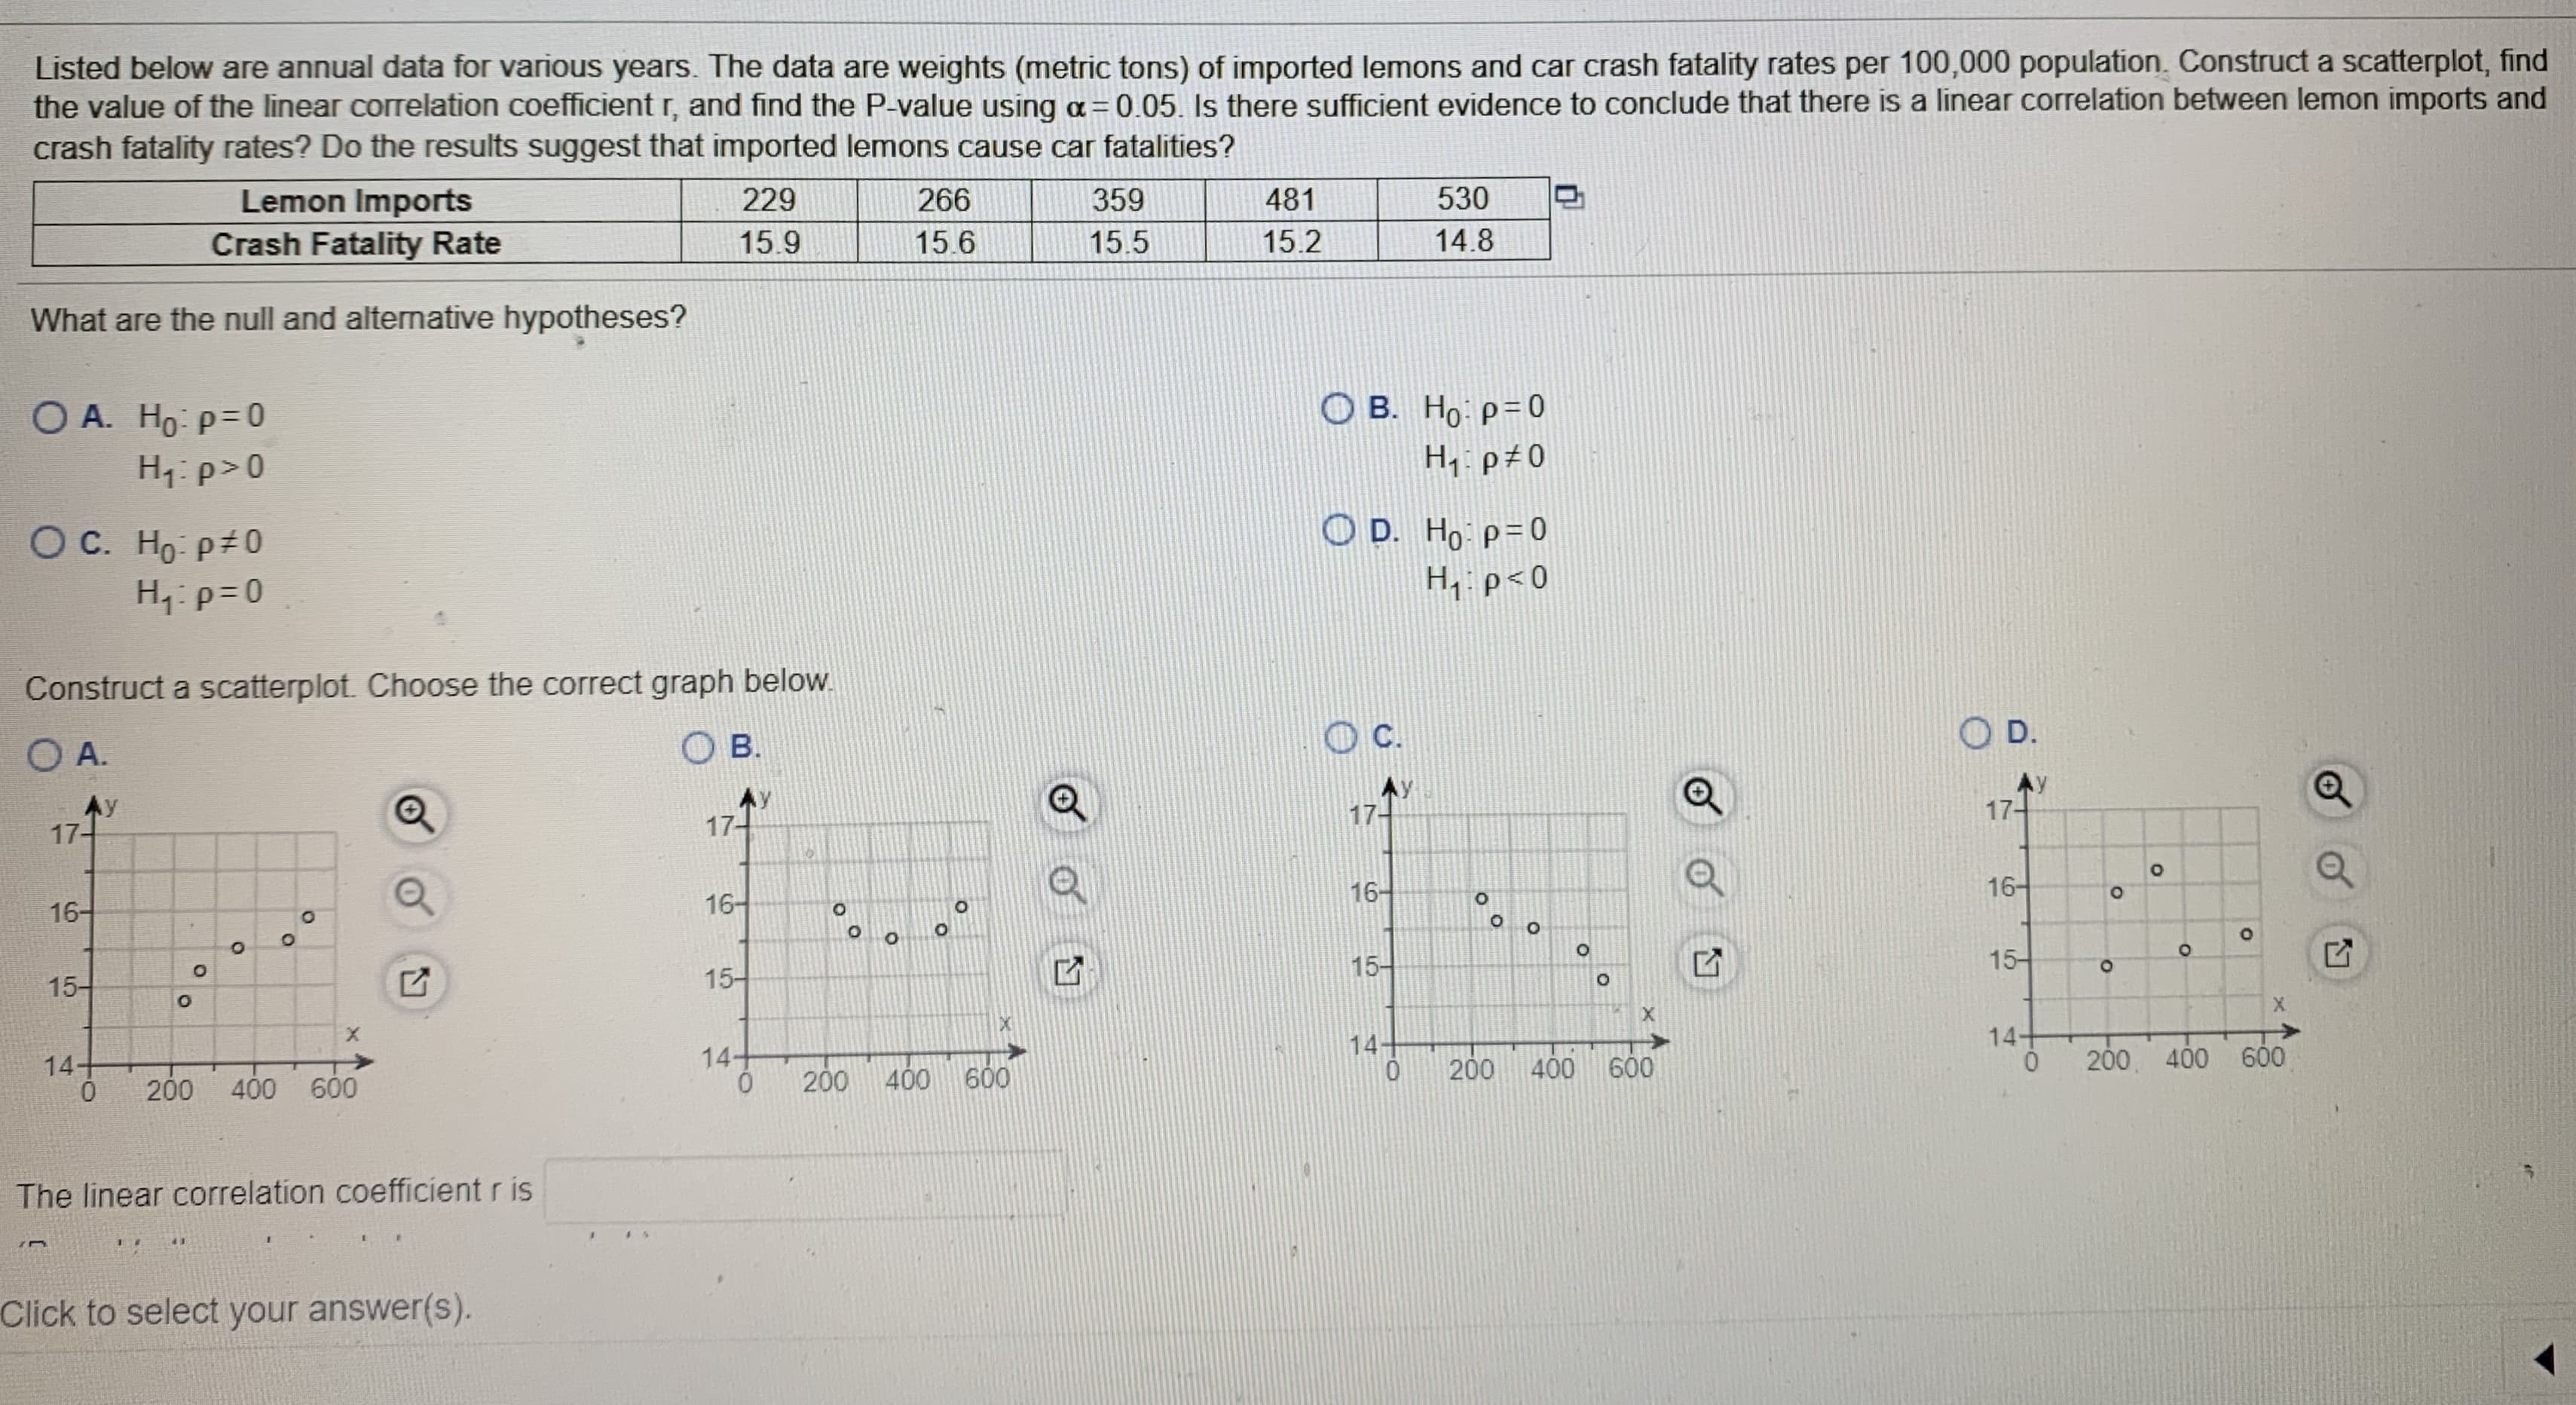
Lisled below are annual data for various years. The data are weights (metri: tons) ol imported lemons and car crash falality rates per 100,000 population. Construct a scatterplot, find the valuc of the linear correlation coetticient r, and find the P-value using a-0.05. Is there sufficient evidence to conclude that there is a linear correlation belween lerrion imports and crash fatality rates? Do the results suggest Ihat irmported lemons cause car fatalities? Lemon Imports 229 266 359 481 530 Crash Fatality Rate 15.9 15.6 15.5 15.2 14.8 What are the null and altemative hypotheses? O B. Ho p-0 H. pt0 O A. Ho p-0 H: p> 0 OD. Ho: p-0 OC. Hg: p40 H: p=0 H, p<0 Construct a scallerplot. Choose the correct graph below OA. OB. OC. OD. AY 17- Ay 17- 17- 17- 16 164 16- 16- 15- 15- 15- 15 14 14- 14- 14 200 400 G0 200 a00 600 200 400 600 200 400 600 The linear correlation coefficient r is


Permutations and Combinations
If there are 5 dishes, they can be relished in any order at a time. In permutation, it should be in a particular order. In combination, the order does not matter. Take 3 letters a, b, and c. The possible ways of pairing any two letters are ab, bc, ac, ba, cb and ca. It is in a particular order. So, this can be called the permutation of a, b, and c. But if the order does not matter then ab is the same as ba. Similarly, bc is the same as cb and ac is the same as ca. Here the list has ab, bc, and ac alone. This can be called the combination of a, b, and c.
Counting Theory
The fundamental counting principle is a rule that is used to count the total number of possible outcomes in a given situation.
Please answer all questions a-e

Step by step
Solved in 3 steps with 6 images


