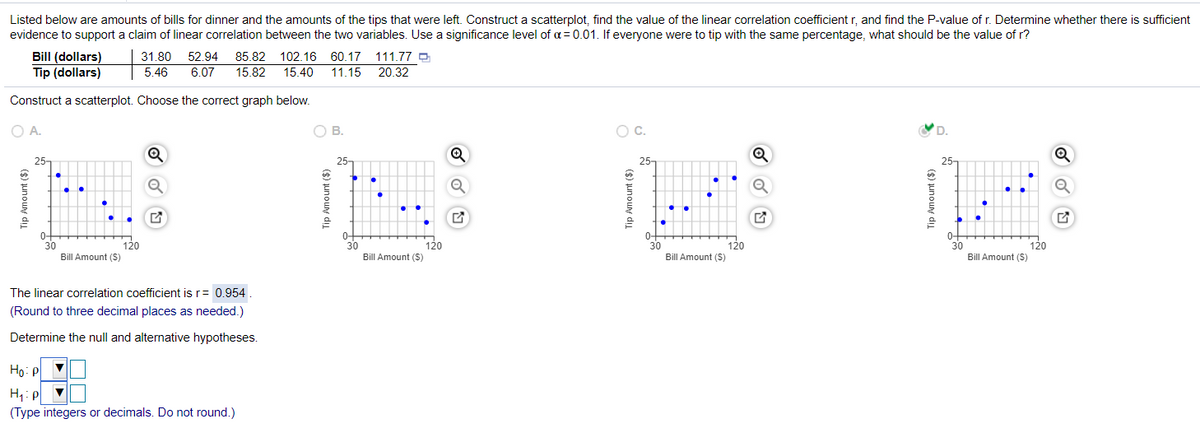
Listed below are amounts of bills for dinner and the amounts of the tips that were left. Construct a scatterplot, find the value of the linear correlation coefficient r, and find the P-value of r. Determine whether there is sufficient evidence to support a claim of linear correlation between the two variables. Use a significance level of a = 0.01. If everyone were to tip with the same percentage, what should be the value of r? Bill (dollars) Tip (dollars) | 31.80 52.94 5.46 6.07 85.82 102.16 60.17 111.77 O 15.82 15.40 11.15 20.32 Construct a scatterplot. Choose the correct graph below. OA. OB. Oc. Q 25- 25- 120 120 Bill Amount ($) 120 Bill Amount (S) 30 120 30 Bill Amount ($) Bill Amount (S) The linear correlation coefficient is r= 0.954 (Round to three decimal places as needed.) Determine the null and alternative hypotheses. Ho: pl H: p v (Type integers or decimals. Do not round.) Tip Amount ($) ip Amount ($)


Correlation
Correlation defines a relationship between two independent variables. It tells the degree to which variables move in relation to each other. When two sets of data are related to each other, there is a correlation between them.
Linear Correlation
A correlation is used to determine the relationships between numerical and categorical variables. In other words, it is an indicator of how things are connected to one another. The correlation analysis is the study of how variables are related.
Regression Analysis
Regression analysis is a statistical method in which it estimates the relationship between a dependent variable and one or more independent variable. In simple terms dependent variable is called as outcome variable and independent variable is called as predictors. Regression analysis is one of the methods to find the trends in data. The independent variable used in Regression analysis is named Predictor variable. It offers data of an associated dependent variable regarding a particular outcome.


Trending now
This is a popular solution!

Step by step
Solved in 3 steps with 3 images


