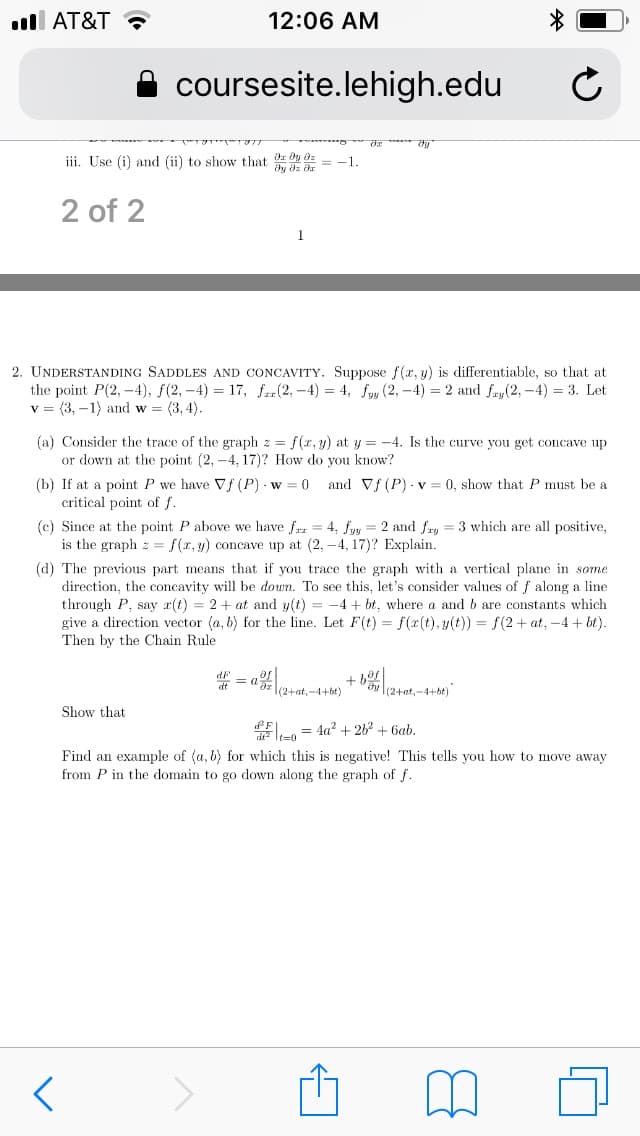
ll AT&T ? 12:06 AM coursesite.lehigh.edu iii. Use (i) and (ii) to show that dy dz = -1. 2 of 2 2. UNDERSTANDING SADDLES AND CONCAVITY. Suppose f(r, y) is differentiable, so that at the point P(2, -4), f(2, -4) = 17, fr(2, -4) = 4, fyy (2, -4) = 2 and fay(2, -4) = 3. Let v = (3, –1) and w = (3, 4). (a) Consider the trace of the graph z = f(x, y) at y = -4. Is the curve you get concave up or down at the point (2, -4, 17)? How do you know? (b) If at a point P we have Vf (P) - w = 0 critical point of f. and Vf (P) - v = 0, show that P must be a (c) Since at the point P above we have frr = 4, fyy = 2 and fry = 3 which are all positive, is the graph z = f(x,y) concave up at (2, -4, 17)? Explain. (d) The previous part means that if you trace the graph with a vertical plane in some direction, the concavity will be down. To see this, let's consider values of f along a line through P, say r(t) give a direction vector (a, b) for the line. Let F(t) = f(x(t),y(t)) f (2 + at, -4 + bt). Then by the Chain Rule 2+ at and y(t) = -4 + bt, where a and b are constants which + b12tat.-4+bt) |(2+at,-4+bt) Show that = 4a? + 262 + 6ab. Find an example of (a, b) for which this is negative! This tells you how to move away from P in the domain to go down along the graph of f.


Addition Rule of Probability
It simply refers to the likelihood of an event taking place whenever the occurrence of an event is uncertain. The probability of a single event can be calculated by dividing the number of successful trials of that event by the total number of trials.
Expected Value
When a large number of trials are performed for any random variable ‘X’, the predicted result is most likely the mean of all the outcomes for the random variable and it is known as expected value also known as expectation. The expected value, also known as the expectation, is denoted by: E(X).
Probability Distributions
Understanding probability is necessary to know the probability distributions. In statistics, probability is how the uncertainty of an event is measured. This event can be anything. The most common examples include tossing a coin, rolling a die, or choosing a card. Each of these events has multiple possibilities. Every such possibility is measured with the help of probability. To be more precise, the probability is used for calculating the occurrence of events that may or may not happen. Probability does not give sure results. Unless the probability of any event is 1, the different outcomes may or may not happen in real life, regardless of how less or how more their probability is.
Basic Probability
The simple definition of probability it is a chance of the occurrence of an event. It is defined in numerical form and the probability value is between 0 to 1. The probability value 0 indicates that there is no chance of that event occurring and the probability value 1 indicates that the event will occur. Sum of the probability value must be 1. The probability value is never a negative number. If it happens, then recheck the calculation.
Question 2 part a


Trending now
This is a popular solution!

Step by step
Solved in 3 steps with 3 images


