Manov Steel Inc. has a rolling mill that produces sheet steel with a nominal thickness of 0.125 inch. Suppose that the specification limits are given by LSL = 0.120 and USL %3D = 0.130 inch. According to historical data, the actual thickness of a random sheet produced by the mill is normally distributed with mean and standard deviation of = 0.125 and o = 0.0025.
Manov Steel Inc. has a rolling mill that produces sheet steel with a nominal thickness of 0.125 inch. Suppose that the specification limits are given by LSL = 0.120 and USL %3D = 0.130 inch. According to historical data, the actual thickness of a random sheet produced by the mill is normally distributed with mean and standard deviation of = 0.125 and o = 0.0025.

Chapter2: Loads On Structures
Section: Chapter Questions
Problem 1P

Related questions

Question
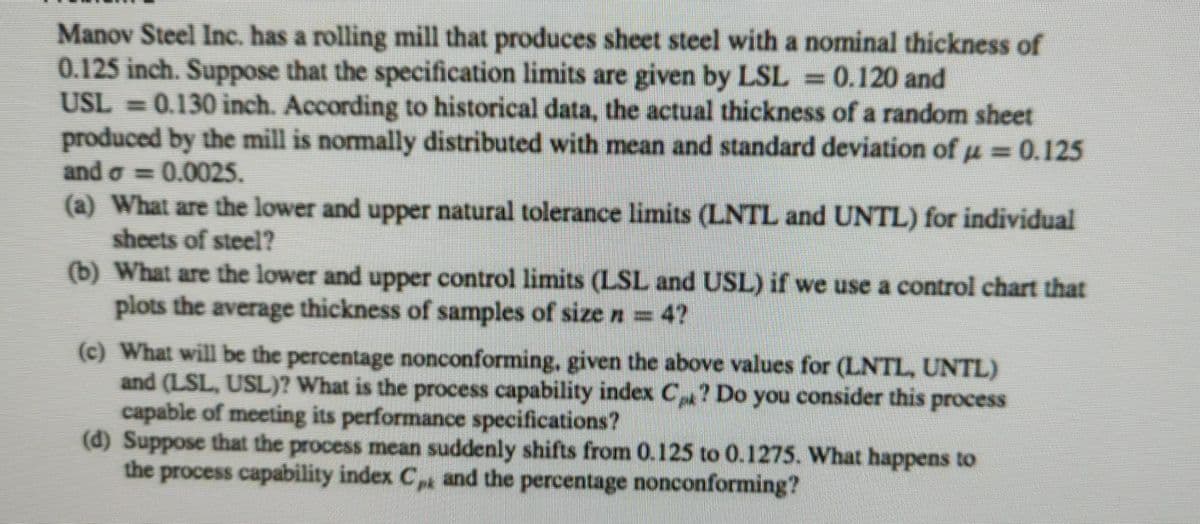
Transcribed Image Text:Manov Steel Inc. has a rolling mill that produces sheet steel with a nominal thickness of
0.125 inch. Suppose that the specification limits are given by LSL = 0.120 and
USL = 0.130 inch. According to historical data, the actual thickness of a random sheet
produced by the mill is normally distributed with mean and standard deviation of u = 0.125
and o = 0.0025.
(a) What are the lower and upper natural tolerance limits (LNTL and UNTL) for individual
sheets of steel?
(b) What are the lower and upper control limits (LSL and USL) if we use a control chart that
plots the average thickness of samples of size n = 4?
(c) What will be the percentage nonconforming, given the above values for (LNTL, UNTL)
and (LSL, USL)? What is the process capability index C? Do you consider this process
capable of meeting its performance specifications?
(d) Suppose that the process mean suddenly shifts from 0.125 to 0.1275. What happens to
the process capability index C and the percentage nonconforming?
Expert Solution
This question has been solved!
Explore an expertly crafted, step-by-step solution for a thorough understanding of key concepts.

This is a popular solution!

Trending now
This is a popular solution!

Step by step
Solved in 2 steps with 3 images

Knowledge Booster


Learn more about
Need a deep-dive on the concept behind this application? Look no further. Learn more about this topic, civil-engineering and related others by exploring similar questions and additional content below.Recommended textbooks for you

Structural Analysis (10th Edition)
Civil Engineering
ISBN:
9780134610672
Author:
Russell C. Hibbeler
Publisher:
PEARSON

Principles of Foundation Engineering (MindTap Cou…
Civil Engineering
ISBN:
9781337705028
Author:
Braja M. Das, Nagaratnam Sivakugan
Publisher:
Cengage Learning
Structural Analysis (10th Edition)
Civil Engineering
ISBN:
9780134610672
Author:
Russell C. Hibbeler
Publisher:
PEARSON
Principles of Foundation Engineering (MindTap Cou…
Civil Engineering
ISBN:
9781337705028
Author:
Braja M. Das, Nagaratnam Sivakugan
Publisher:
Cengage Learning

Fundamentals of Structural Analysis
Civil Engineering
ISBN:
9780073398006
Author:
Kenneth M. Leet Emeritus, Chia-Ming Uang, Joel Lanning
Publisher:
McGraw-Hill Education


Traffic and Highway Engineering
Civil Engineering
ISBN:
9781305156241
Author:
Garber, Nicholas J.
Publisher:
Cengage Learning