
Chapter13: Capital, Interest, Entrepreneurship, And Corporate Finance
Section: Chapter Questions
Problem 2.4P

Related questions
Question
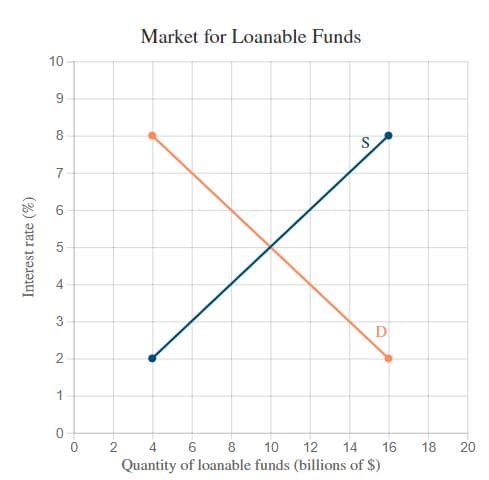
The accompanying graph represents the market for loanable funds in the hypothetical country of Bunko. Assume the market is initially in equilibrium and inflation expectations are 2%.
a. Adjust the graph to demonstrate the effects of inflation expectations increasing from 2% to 4%.
Market for Loanable FundsInterest rate (%)Quantity of loanable funds (billions of $)02468101214161820012345678910DS
b. What is the real interest rate after the change in inflation expectations?
3%
2%
5%
7%
c. Which effect below characterizes the relationship between inflation expectations and nominal interest rates?
The Leontief Paradox
The Inflation effect
The Fisher effect
The Pigou effect
Transcribed Image Text:Market for Loanable Funds
10
S
7
3
D
2
1
C
4.
C
2
6
10
12
14
16
18
20
Quantity of loanable funds (billions of $)
Interest
rate (%)
LO
Expert Solution
This question has been solved!
Explore an expertly crafted, step-by-step solution for a thorough understanding of key concepts.

This is a popular solution!

Trending now
This is a popular solution!

Step by step
Solved in 3 steps with 3 images

Knowledge Booster


Learn more about
Need a deep-dive on the concept behind this application? Look no further. Learn more about this topic, economics and related others by exploring similar questions and additional content below.Recommended textbooks for you