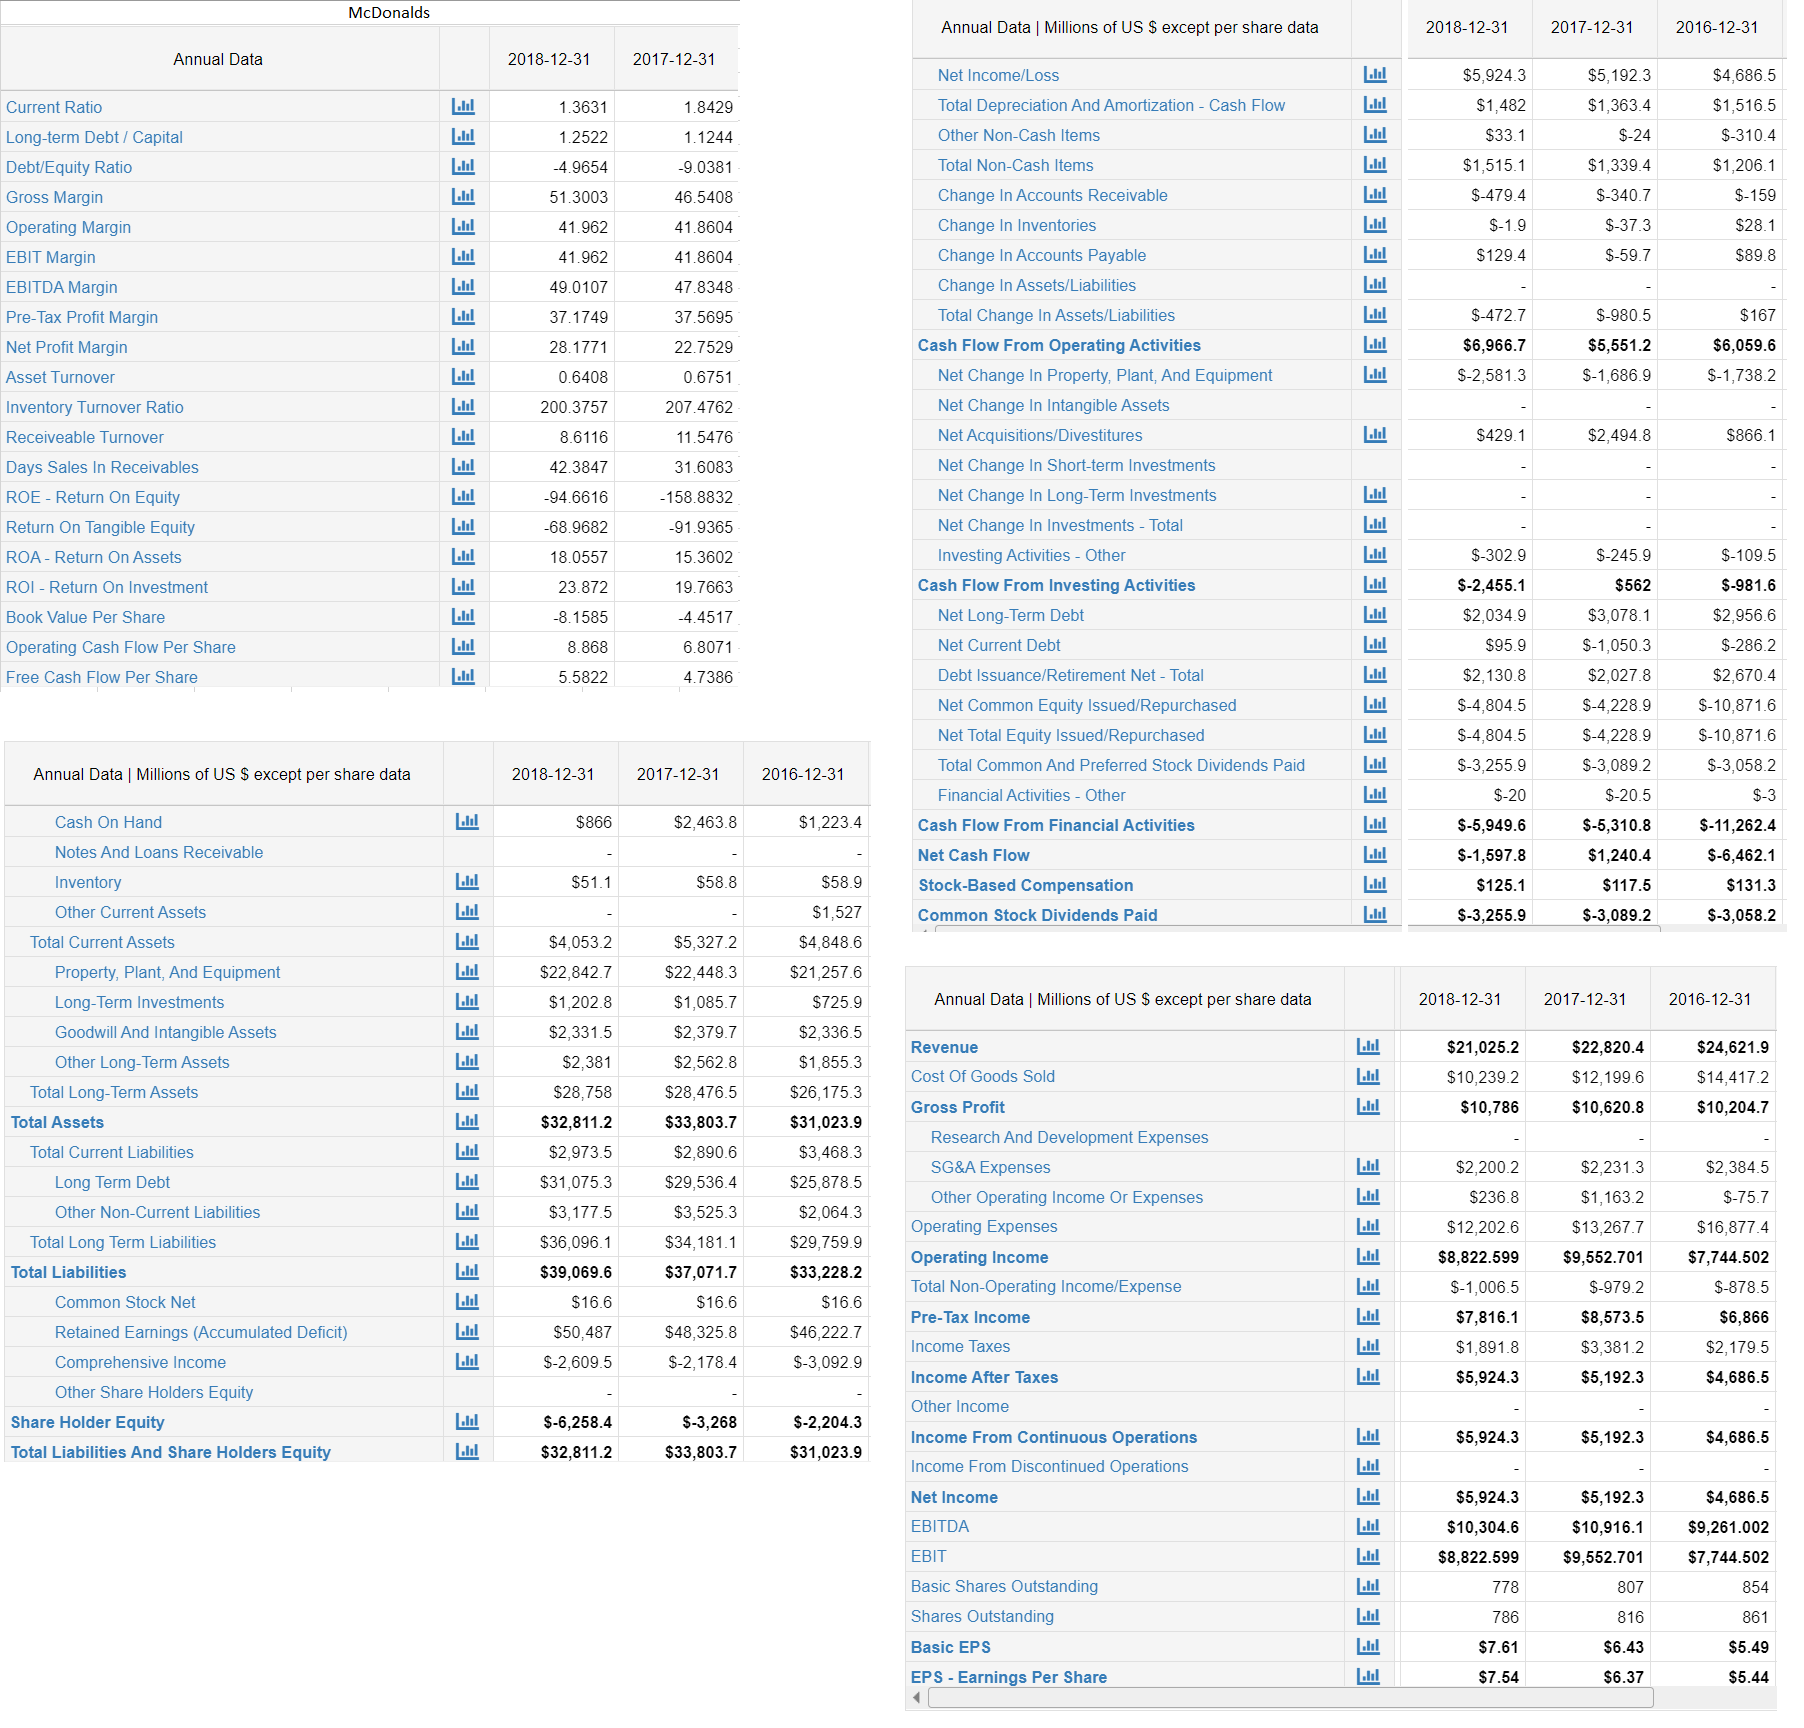
McDonalds Annual Data | Millions of US $ except per share data 2016-12-31 2018-12-31 2017-12-31 2017-12-31 Annual Data 2018-12-31 Llal Net Income/Los $5,924.3 $5,192.3 $4,686.5 Llul Lll $1,482 $1,363.4 $1,516.5 1.3631 Total Depreciation And Amortization - Cash Flow 1.8429 Current Ratio Llul Lal $33.1 $-24 $-310.4 Long-term Debt / Capital Other Non-Cash Items 1.2522 1.1244 Llal Lll $1,515.1 $1,339.4 $1,206.1 Total Non-Cash Items Debt/Equity Ratio -4.9654 -9.0381 Change In Accounts Receivable Lll Lll $-479.4 $-340.7 $-159 Gross Margin 51.3003 46.5408 Llal $-1.9 $-37.3 Change In Inventories $28.1 Operating Margin 41.962 41.8604 Llil EBIT Margin $129.4 $-59.7 $89.8 Change In Accounts Payable 41.8604 41.962 Change In Assets/Liabilities Lll EBITDA Margin 49.0107 47.8348 $-980.5 Total Change In Assets/Liabilities $167 Pre-Tax Profit Margin 37.5695 $-472.7 37.1749 Llal $6,966.7 $5,551.2 $6,059.6 Net Profit Margin 22.7529 Cash Flow From Operating Activities 28.1771 Llul S-2,581.3 $-1,686.9 $-1,738.2 Net Change In Property, Plant, And Equipment 0.6408 Asset Turnover 0.6751 Net Change In Intangible Assets Inventory Turnover Ratio 200.3757 207.4762 $429.1 $2,494.8 $866.1 Net Acquisitions/Divestitures 11.5476 Receiveable Turnover 8.6116 Net Change In Short-term Investments Days Sales In Receivables 42.3847 31.6083 Llal Net Change In Long-Term Investments ROE - Return On Equity Lll -94.6616 -158.8832 Lll Return On Tangible Equity Net Change In Investments - Total -68.9682 -91.9365 Lll ROA - Return On Assets $-109.5 $-302.9 $-245.9 Investing Activities - Other 18.0557 15.3602 Llal ROI - Return On Investment Cash Flow From Investing Activities $-2,455.1 $562 $-981.6 23.872 19.7663 Net Long-Term Debt $2,034.9 $3,078.1 $2,956.6 Book Value Per Share -8.1585 -4.4517 Net Current Debt $95.9 $-1,050.3 $-286.2 Operating Cash Flow Per Share 8.868 6.8071 Debt Issuance/Retirement Net - Total Llul $2,130.8 Lll $2,027.8 $2,670.4 5.5822 4.7386 Free Cash Flow Per Share Llal $-4,804.5 $-4,228.9 $-10,871.6 Net Common Equity Issued/Repurchased Net Total Equity Issued/Repurchased S-4,804.5 $-4,228.9 $-10,871.6 Llal $-3,255.9 $-3,089.2 S-3,058.2 Total Common And Preferred Stock Dividends Paid Annual Data | Millions of US $ except per share data 2017-12-31 2018-12-31 2016-12-31 Lll $-20.5 $-20 $-3 Financial Activities - Other Cash On Hand $866 $2,463.8 $1,223.4 Llal $-5,949.6 $-5,310.8 $-11,262.4 Cash Flow From Financial Activities Notes And Loans Receivable Llal $-1,597.8 $1,240.4 $-6,462.1 Net Cash Flow $51.1 $58.8 $58.9 Inventory Lll $125.1 Stock-Based Compensation $117.5 $131.3 $1,527 Other Current Assets $-3,255.9 $-3,089.2 $-3,058.2 Common Stock Dividends Paid Llil $4,053.2 $5,327.2 $4,848.6 Total Current Assets Llal Property, Plant, And Equipment $22,842.7 $22,448.3 $21,257.6 Annual Data | Millions of US $ except per share data 2018-12-31 2016-12-31 Lll 2017-12-31 $725.9 Long-Term Investments $1,202.8 $1,085.7 Lll Goodwill And Intangible Assets $2,331.5 $2,379.7 $2,336.5 Llul $22,820.4 $21,025.2 $24,621.9 Revenue Llul Other Long-Term Assets $2,381 $2,562.8 $1,855.3 Cost Of Goods Sold Llul $10,239.2 $12,199.6 $14,417.2 Total Long-Term Assets $28,758 $28,476.5 $26,175.3 Llul $10,786 $10,620.8 $10,204.7 Gross Profit Llul $32,811.2 $33,803.7 $31,023.9 Total Assets Research And Development Expenses Llul $2,973.5 $2,890.6 $3,468.3 Total Current Liabilities SG&A Expenses $2,200.2 $2,231.3 $2,384.5 Llil $31,075.3 $29,536.4 $25,878.5 Long Term Debt Other Operating Income Or Expenses $236.8 $1,163.2 $-75.7 Llul $3,177.5 $3,525.3 $2,064.3 Other Non-Current Liabilities $16,877.4 Operating Expenses $12,202.6 $13,267.7 Lll Total Long Term Liabilities $36,096.1 $34,181.1 $29,759.9 Lll Operating Income $8,822.599 $9,552.701 $7,744.502 Lll $39,069.6 $37,071.7 $33,228.2 Total Liabilities Lll Total Non-Operating Income/Expense $-1,006.5 $-979.2 $-878.5 Lll $16.6 $16.6 $16.6 Common Stock Net $7,816.1 $8,573.5 $6,866 Pre-Tax Income Lll $50,487 $48,325.8 $46,222.7 Retained Earnings (Accumulated Deficit) Lll Income Taxes $1,891.8 $3,381.2 $2,179.5 $-2,609.5 $-2,178.4 $-3,092.9 Comprehensive Income Llul $5,924.3 $5,192.3 $4,686.5 Income After Taxes Other Share Holders Equity Other Income Llul $-2,204.3 Share Holder Equity $-6,258.4 $-3,268 Llul $5,924.3 $5,192.3 $4,686.5 Income From Continuous Operations Lll Total Liabilities And Share Holders Equity $32,811.2 $33,803.7 $31,023.9 Income From Discontinued Operations Net Income $5,924.3 $5,192.3 $4,686.5 EBITDA $9,261.002 $10,304.6 $10,916.1 EBIT $8,822.599 $9,552.701 $7,744.502 Basic Shares Outstanding Lll 778 807 854 Shares Outstanding 786 816 861 Llul $7.61 $6.43 $5.49 Basic EPS Llul $5.44 $7.54 $6.37 EPS - Earnings Per Share 3333333333
McDonalds Annual Data | Millions of US $ except per share data 2016-12-31 2018-12-31 2017-12-31 2017-12-31 Annual Data 2018-12-31 Llal Net Income/Los $5,924.3 $5,192.3 $4,686.5 Llul Lll $1,482 $1,363.4 $1,516.5 1.3631 Total Depreciation And Amortization - Cash Flow 1.8429 Current Ratio Llul Lal $33.1 $-24 $-310.4 Long-term Debt / Capital Other Non-Cash Items 1.2522 1.1244 Llal Lll $1,515.1 $1,339.4 $1,206.1 Total Non-Cash Items Debt/Equity Ratio -4.9654 -9.0381 Change In Accounts Receivable Lll Lll $-479.4 $-340.7 $-159 Gross Margin 51.3003 46.5408 Llal $-1.9 $-37.3 Change In Inventories $28.1 Operating Margin 41.962 41.8604 Llil EBIT Margin $129.4 $-59.7 $89.8 Change In Accounts Payable 41.8604 41.962 Change In Assets/Liabilities Lll EBITDA Margin 49.0107 47.8348 $-980.5 Total Change In Assets/Liabilities $167 Pre-Tax Profit Margin 37.5695 $-472.7 37.1749 Llal $6,966.7 $5,551.2 $6,059.6 Net Profit Margin 22.7529 Cash Flow From Operating Activities 28.1771 Llul S-2,581.3 $-1,686.9 $-1,738.2 Net Change In Property, Plant, And Equipment 0.6408 Asset Turnover 0.6751 Net Change In Intangible Assets Inventory Turnover Ratio 200.3757 207.4762 $429.1 $2,494.8 $866.1 Net Acquisitions/Divestitures 11.5476 Receiveable Turnover 8.6116 Net Change In Short-term Investments Days Sales In Receivables 42.3847 31.6083 Llal Net Change In Long-Term Investments ROE - Return On Equity Lll -94.6616 -158.8832 Lll Return On Tangible Equity Net Change In Investments - Total -68.9682 -91.9365 Lll ROA - Return On Assets $-109.5 $-302.9 $-245.9 Investing Activities - Other 18.0557 15.3602 Llal ROI - Return On Investment Cash Flow From Investing Activities $-2,455.1 $562 $-981.6 23.872 19.7663 Net Long-Term Debt $2,034.9 $3,078.1 $2,956.6 Book Value Per Share -8.1585 -4.4517 Net Current Debt $95.9 $-1,050.3 $-286.2 Operating Cash Flow Per Share 8.868 6.8071 Debt Issuance/Retirement Net - Total Llul $2,130.8 Lll $2,027.8 $2,670.4 5.5822 4.7386 Free Cash Flow Per Share Llal $-4,804.5 $-4,228.9 $-10,871.6 Net Common Equity Issued/Repurchased Net Total Equity Issued/Repurchased S-4,804.5 $-4,228.9 $-10,871.6 Llal $-3,255.9 $-3,089.2 S-3,058.2 Total Common And Preferred Stock Dividends Paid Annual Data | Millions of US $ except per share data 2017-12-31 2018-12-31 2016-12-31 Lll $-20.5 $-20 $-3 Financial Activities - Other Cash On Hand $866 $2,463.8 $1,223.4 Llal $-5,949.6 $-5,310.8 $-11,262.4 Cash Flow From Financial Activities Notes And Loans Receivable Llal $-1,597.8 $1,240.4 $-6,462.1 Net Cash Flow $51.1 $58.8 $58.9 Inventory Lll $125.1 Stock-Based Compensation $117.5 $131.3 $1,527 Other Current Assets $-3,255.9 $-3,089.2 $-3,058.2 Common Stock Dividends Paid Llil $4,053.2 $5,327.2 $4,848.6 Total Current Assets Llal Property, Plant, And Equipment $22,842.7 $22,448.3 $21,257.6 Annual Data | Millions of US $ except per share data 2018-12-31 2016-12-31 Lll 2017-12-31 $725.9 Long-Term Investments $1,202.8 $1,085.7 Lll Goodwill And Intangible Assets $2,331.5 $2,379.7 $2,336.5 Llul $22,820.4 $21,025.2 $24,621.9 Revenue Llul Other Long-Term Assets $2,381 $2,562.8 $1,855.3 Cost Of Goods Sold Llul $10,239.2 $12,199.6 $14,417.2 Total Long-Term Assets $28,758 $28,476.5 $26,175.3 Llul $10,786 $10,620.8 $10,204.7 Gross Profit Llul $32,811.2 $33,803.7 $31,023.9 Total Assets Research And Development Expenses Llul $2,973.5 $2,890.6 $3,468.3 Total Current Liabilities SG&A Expenses $2,200.2 $2,231.3 $2,384.5 Llil $31,075.3 $29,536.4 $25,878.5 Long Term Debt Other Operating Income Or Expenses $236.8 $1,163.2 $-75.7 Llul $3,177.5 $3,525.3 $2,064.3 Other Non-Current Liabilities $16,877.4 Operating Expenses $12,202.6 $13,267.7 Lll Total Long Term Liabilities $36,096.1 $34,181.1 $29,759.9 Lll Operating Income $8,822.599 $9,552.701 $7,744.502 Lll $39,069.6 $37,071.7 $33,228.2 Total Liabilities Lll Total Non-Operating Income/Expense $-1,006.5 $-979.2 $-878.5 Lll $16.6 $16.6 $16.6 Common Stock Net $7,816.1 $8,573.5 $6,866 Pre-Tax Income Lll $50,487 $48,325.8 $46,222.7 Retained Earnings (Accumulated Deficit) Lll Income Taxes $1,891.8 $3,381.2 $2,179.5 $-2,609.5 $-2,178.4 $-3,092.9 Comprehensive Income Llul $5,924.3 $5,192.3 $4,686.5 Income After Taxes Other Share Holders Equity Other Income Llul $-2,204.3 Share Holder Equity $-6,258.4 $-3,268 Llul $5,924.3 $5,192.3 $4,686.5 Income From Continuous Operations Lll Total Liabilities And Share Holders Equity $32,811.2 $33,803.7 $31,023.9 Income From Discontinued Operations Net Income $5,924.3 $5,192.3 $4,686.5 EBITDA $9,261.002 $10,304.6 $10,916.1 EBIT $8,822.599 $9,552.701 $7,744.502 Basic Shares Outstanding Lll 778 807 854 Shares Outstanding 786 816 861 Llul $7.61 $6.43 $5.49 Basic EPS Llul $5.44 $7.54 $6.37 EPS - Earnings Per Share 3333333333

Essentials Of Investments
11th Edition
ISBN:9781260013924
Author:Bodie, Zvi, Kane, Alex, MARCUS, Alan J.
Publisher:Bodie, Zvi, Kane, Alex, MARCUS, Alan J.
Chapter1: Investments: Background And Issues
Section: Chapter Questions
Problem 1PS

Related questions
Question
Using the financial statements in the image, calculate the following ratios for both the FY 2017 and FY 2018:
- Current Ratio
- Quick Ratio
- Total Asset Turnover
- Average Collection
- Total Debt to Total Assets
- Times Interest Earned
- Net Profit Margin
Return on Assets Return on Equity - Modified Du Point Equation for FY 2018
- PE Ratio
- Market to Book Ratio
Transcribed Image Text:McDonalds
Annual Data | Millions of US $ except per share data
2016-12-31
2018-12-31
2017-12-31
2017-12-31
Annual Data
2018-12-31
Llal
Net Income/Los
$5,924.3
$5,192.3
$4,686.5
Llul
Lll
$1,482
$1,363.4
$1,516.5
1.3631
Total Depreciation And Amortization - Cash Flow
1.8429
Current Ratio
Llul
Lal
$33.1
$-24
$-310.4
Long-term Debt / Capital
Other Non-Cash Items
1.2522
1.1244
Llal
Lll
$1,515.1
$1,339.4
$1,206.1
Total Non-Cash Items
Debt/Equity Ratio
-4.9654
-9.0381
Change In Accounts Receivable
Lll
Lll
$-479.4
$-340.7
$-159
Gross Margin
51.3003
46.5408
Llal
$-1.9
$-37.3
Change In Inventories
$28.1
Operating Margin
41.962
41.8604
Llil
EBIT Margin
$129.4
$-59.7
$89.8
Change In Accounts Payable
41.8604
41.962
Change In Assets/Liabilities
Lll
EBITDA Margin
49.0107
47.8348
$-980.5
Total Change In Assets/Liabilities
$167
Pre-Tax Profit Margin
37.5695
$-472.7
37.1749
Llal
$6,966.7
$5,551.2
$6,059.6
Net Profit Margin
22.7529
Cash Flow From Operating Activities
28.1771
Llul
S-2,581.3
$-1,686.9
$-1,738.2
Net Change In Property, Plant, And Equipment
0.6408
Asset Turnover
0.6751
Net Change In Intangible Assets
Inventory Turnover Ratio
200.3757
207.4762
$429.1
$2,494.8
$866.1
Net Acquisitions/Divestitures
11.5476
Receiveable Turnover
8.6116
Net Change In Short-term Investments
Days Sales In Receivables
42.3847
31.6083
Llal
Net Change In Long-Term Investments
ROE - Return On Equity
Lll
-94.6616
-158.8832
Lll
Return On Tangible Equity
Net Change In Investments - Total
-68.9682
-91.9365
Lll
ROA - Return On Assets
$-109.5
$-302.9
$-245.9
Investing Activities - Other
18.0557
15.3602
Llal
ROI - Return On Investment
Cash Flow From Investing Activities
$-2,455.1
$562
$-981.6
23.872
19.7663
Net Long-Term Debt
$2,034.9
$3,078.1
$2,956.6
Book Value Per Share
-8.1585
-4.4517
Net Current Debt
$95.9
$-1,050.3
$-286.2
Operating Cash Flow Per Share
8.868
6.8071
Debt Issuance/Retirement Net - Total
Llul
$2,130.8
Lll
$2,027.8
$2,670.4
5.5822
4.7386
Free Cash Flow Per Share
Llal
$-4,804.5
$-4,228.9
$-10,871.6
Net Common Equity Issued/Repurchased
Net Total Equity Issued/Repurchased
S-4,804.5
$-4,228.9
$-10,871.6
Llal
$-3,255.9
$-3,089.2
S-3,058.2
Total Common And Preferred Stock Dividends Paid
Annual Data | Millions of US $ except per share data
2017-12-31
2018-12-31
2016-12-31
Lll
$-20.5
$-20
$-3
Financial Activities - Other
Cash On Hand
$866
$2,463.8
$1,223.4
Llal
$-5,949.6
$-5,310.8
$-11,262.4
Cash Flow From Financial Activities
Notes And Loans Receivable
Llal
$-1,597.8
$1,240.4
$-6,462.1
Net Cash Flow
$51.1
$58.8
$58.9
Inventory
Lll
$125.1
Stock-Based Compensation
$117.5
$131.3
$1,527
Other Current Assets
$-3,255.9
$-3,089.2
$-3,058.2
Common Stock Dividends Paid
Llil
$4,053.2
$5,327.2
$4,848.6
Total Current Assets
Llal
Property, Plant, And Equipment
$22,842.7
$22,448.3
$21,257.6
Annual Data | Millions of US $ except per share data
2018-12-31
2016-12-31
Lll
2017-12-31
$725.9
Long-Term Investments
$1,202.8
$1,085.7
Lll
Goodwill And Intangible Assets
$2,331.5
$2,379.7
$2,336.5
Llul
$22,820.4
$21,025.2
$24,621.9
Revenue
Llul
Other Long-Term Assets
$2,381
$2,562.8
$1,855.3
Cost Of Goods Sold
Llul
$10,239.2
$12,199.6
$14,417.2
Total Long-Term Assets
$28,758
$28,476.5
$26,175.3
Llul
$10,786
$10,620.8
$10,204.7
Gross Profit
Llul
$32,811.2
$33,803.7
$31,023.9
Total Assets
Research And Development Expenses
Llul
$2,973.5
$2,890.6
$3,468.3
Total Current Liabilities
SG&A Expenses
$2,200.2
$2,231.3
$2,384.5
Llil
$31,075.3
$29,536.4
$25,878.5
Long Term Debt
Other Operating Income Or Expenses
$236.8
$1,163.2
$-75.7
Llul
$3,177.5
$3,525.3
$2,064.3
Other Non-Current Liabilities
$16,877.4
Operating Expenses
$12,202.6
$13,267.7
Lll
Total Long Term Liabilities
$36,096.1
$34,181.1
$29,759.9
Lll
Operating Income
$8,822.599
$9,552.701
$7,744.502
Lll
$39,069.6
$37,071.7
$33,228.2
Total Liabilities
Lll
Total Non-Operating Income/Expense
$-1,006.5
$-979.2
$-878.5
Lll
$16.6
$16.6
$16.6
Common Stock Net
$7,816.1
$8,573.5
$6,866
Pre-Tax Income
Lll
$50,487
$48,325.8
$46,222.7
Retained Earnings (Accumulated Deficit)
Lll
Income Taxes
$1,891.8
$3,381.2
$2,179.5
$-2,609.5
$-2,178.4
$-3,092.9
Comprehensive Income
Llul
$5,924.3
$5,192.3
$4,686.5
Income After Taxes
Other Share Holders Equity
Other Income
Llul
$-2,204.3
Share Holder Equity
$-6,258.4
$-3,268
Llul
$5,924.3
$5,192.3
$4,686.5
Income From Continuous Operations
Lll
Total Liabilities And Share Holders Equity
$32,811.2
$33,803.7
$31,023.9
Income From Discontinued Operations
Net Income
$5,924.3
$5,192.3
$4,686.5
EBITDA
$9,261.002
$10,304.6
$10,916.1
EBIT
$8,822.599
$9,552.701
$7,744.502
Basic Shares Outstanding
Lll
778
807
854
Shares Outstanding
786
816
861
Llul
$7.61
$6.43
$5.49
Basic EPS
Llul
$5.44
$7.54
$6.37
EPS - Earnings Per Share
3333333333
Expert Solution
Step 1
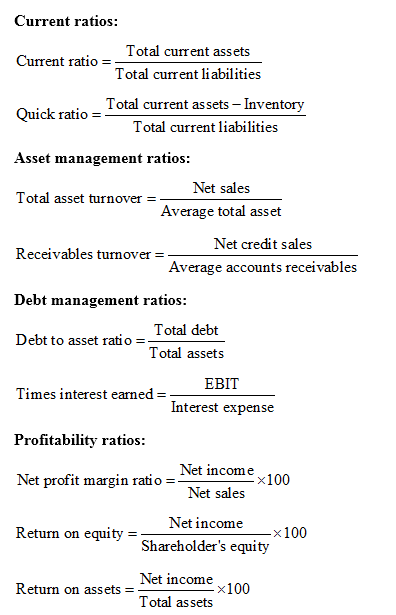
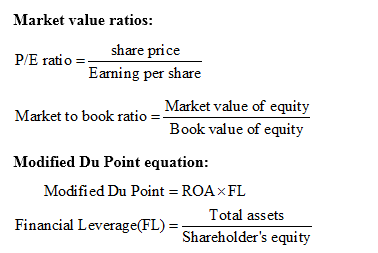
Ratio analysis is a tool used by the various people to analyze the financial statement of a company. There are various ratios which helps an investor, managers and public to assess the company’s operational efficiency, profitability along with its liquidity position in the existing market.
Given Information: Financial statement of Company MD.
Step 2
Formulae used to calculate financial ratios:
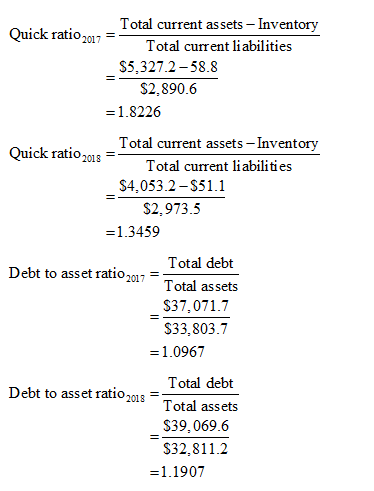
Step 3
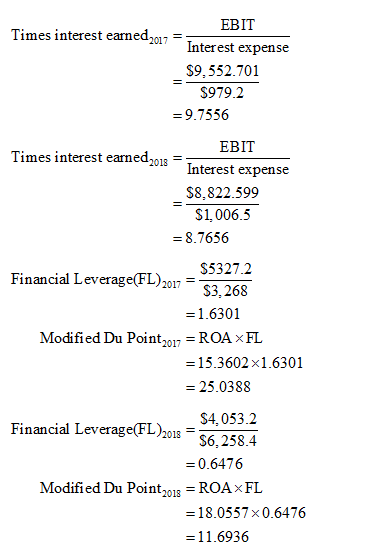
Calculations:
Some of the ratios are given for which calculations are not shown. The rest of the ratios are calculated as follows:
Step 4

Step by step
Solved in 7 steps with 6 images

Knowledge Booster


Learn more about
Need a deep-dive on the concept behind this application? Look no further. Learn more about this topic, finance and related others by exploring similar questions and additional content below.Recommended textbooks for you
Essentials Of Investments
Finance
ISBN:
9781260013924
Author:
Bodie, Zvi, Kane, Alex, MARCUS, Alan J.
Publisher:
Mcgraw-hill Education,


Essentials Of Investments
Finance
ISBN:
9781260013924
Author:
Bodie, Zvi, Kane, Alex, MARCUS, Alan J.
Publisher:
Mcgraw-hill Education,

Foundations Of Finance
Finance
ISBN:
9780134897264
Author:
KEOWN, Arthur J., Martin, John D., PETTY, J. William
Publisher:
Pearson,

Fundamentals of Financial Management (MindTap Cou…
Finance
ISBN:
9781337395250
Author:
Eugene F. Brigham, Joel F. Houston
Publisher:
Cengage Learning

Corporate Finance (The Mcgraw-hill/Irwin Series i…
Finance
ISBN:
9780077861759
Author:
Stephen A. Ross Franco Modigliani Professor of Financial Economics Professor, Randolph W Westerfield Robert R. Dockson Deans Chair in Bus. Admin., Jeffrey Jaffe, Bradford D Jordan Professor
Publisher:
McGraw-Hill Education