meuu Lab 5: Measurement of Acceleration SA your data actually follows "t", "t", "t4", etc. (graph such functions for yourself and see). How do we know which mathematical function actually describes our data? The answer is that we can't see easily by eye if we graph "x" verses "t" outright. However, lines are unique functions in science. There is no other class of functions that remotely resemble a line. Thus, it would be better to re-cast our variables so that they form a linear rement of Accele relationship the theory. If the data does not go through the line, the function used to recast the line (that we tried to make the data follow) must not be the function that fits our data. on our graph. Then, if a theoretical line goes through our data, our data matches does your data ur work for cr at If you know a line has the mathematical function: y = mx + b where "m" is the slope and 2. at "b" is the y-intercept for the function, 1 х 2at2 value in which variable is the "y" in the equation of the line, which variable is the "x" in the equation, which quantity is the "slope", and which quantity is the "y-intercept"? Write y-vanabu is me disiane, dnd ne X Vandale un tre timesquarcdhecause me dintaunce your answer below. Tne TL rate en enangpmetime yintercupt is d-o On a computer program, grapí on the y-axis "x" and the x-axis "t. Does your data M cemtant leut timeuschangs Tme AIOReus 3. look like a line? Yes Lab 5: Measurement of Acceleration your data actually follows "t", "t3", "4",etc. (graph such functions for yourself and see). How do we know which mathematical function actually describes our data? The answer is that we can't see easily by eye if we graph "x" verses "t" outright. However, lines are unique functions in science. There is no other class of functions that remotely resemble a line. Thus, it would be better to re-cast our variables so that they form a linear Arement of Acceleratio relationship the theory. If the data does not go through the line, the function used to recast the line (that we tried to make the data follow) must not be the function that fits our data. on our graph. Then, if a theoretical line goes through our data, our data matches does your data ur work for credit. atz 2 2. If you know a line has the mathematical function: y = mx + b where "m" is the slope and "b" is the y-intercept for the function, at 1 2at2 value in the which variable is the "y" in the equation of the line, which variable is the "x" in the equation, which quantity is the "slope", and which quantity is the "y-intercept? Write your answer below. ne y-vanaolu X Vanidale un me timesauarcd ecause me dintaunce is tme distane, dnd me S cemstant leut timewchanagi Tma AIOpes raute eh Cnangepmetime.yintercupt is d-o T 3. On a computer program, graph on the y-axis "x" and the x-axis "t. Does your data look like a line? ar yes
meuu Lab 5: Measurement of Acceleration SA your data actually follows "t", "t", "t4", etc. (graph such functions for yourself and see). How do we know which mathematical function actually describes our data? The answer is that we can't see easily by eye if we graph "x" verses "t" outright. However, lines are unique functions in science. There is no other class of functions that remotely resemble a line. Thus, it would be better to re-cast our variables so that they form a linear rement of Accele relationship the theory. If the data does not go through the line, the function used to recast the line (that we tried to make the data follow) must not be the function that fits our data. on our graph. Then, if a theoretical line goes through our data, our data matches does your data ur work for cr at If you know a line has the mathematical function: y = mx + b where "m" is the slope and 2. at "b" is the y-intercept for the function, 1 х 2at2 value in which variable is the "y" in the equation of the line, which variable is the "x" in the equation, which quantity is the "slope", and which quantity is the "y-intercept"? Write y-vanabu is me disiane, dnd ne X Vandale un tre timesquarcdhecause me dintaunce your answer below. Tne TL rate en enangpmetime yintercupt is d-o On a computer program, grapí on the y-axis "x" and the x-axis "t. Does your data M cemtant leut timeuschangs Tme AIOReus 3. look like a line? Yes Lab 5: Measurement of Acceleration your data actually follows "t", "t3", "4",etc. (graph such functions for yourself and see). How do we know which mathematical function actually describes our data? The answer is that we can't see easily by eye if we graph "x" verses "t" outright. However, lines are unique functions in science. There is no other class of functions that remotely resemble a line. Thus, it would be better to re-cast our variables so that they form a linear Arement of Acceleratio relationship the theory. If the data does not go through the line, the function used to recast the line (that we tried to make the data follow) must not be the function that fits our data. on our graph. Then, if a theoretical line goes through our data, our data matches does your data ur work for credit. atz 2 2. If you know a line has the mathematical function: y = mx + b where "m" is the slope and "b" is the y-intercept for the function, at 1 2at2 value in the which variable is the "y" in the equation of the line, which variable is the "x" in the equation, which quantity is the "slope", and which quantity is the "y-intercept? Write your answer below. ne y-vanaolu X Vanidale un me timesauarcd ecause me dintaunce is tme distane, dnd me S cemstant leut timewchanagi Tma AIOpes raute eh Cnangepmetime.yintercupt is d-o T 3. On a computer program, graph on the y-axis "x" and the x-axis "t. Does your data look like a line? ar yes

College Physics
1st Edition
ISBN:9781938168000
Author:Paul Peter Urone, Roger Hinrichs
Publisher:Paul Peter Urone, Roger Hinrichs
Chapter3: Two-dimensional Kinematics
Section: Chapter Questions
Problem 64PE: (a) Use the distance and velocity data in Figure 3.64 to find the rate of expansion as a function of...

Related questions
Question
Can you help me on question two?
Transcribed Image Text:meuu
Lab 5: Measurement of Acceleration
SA
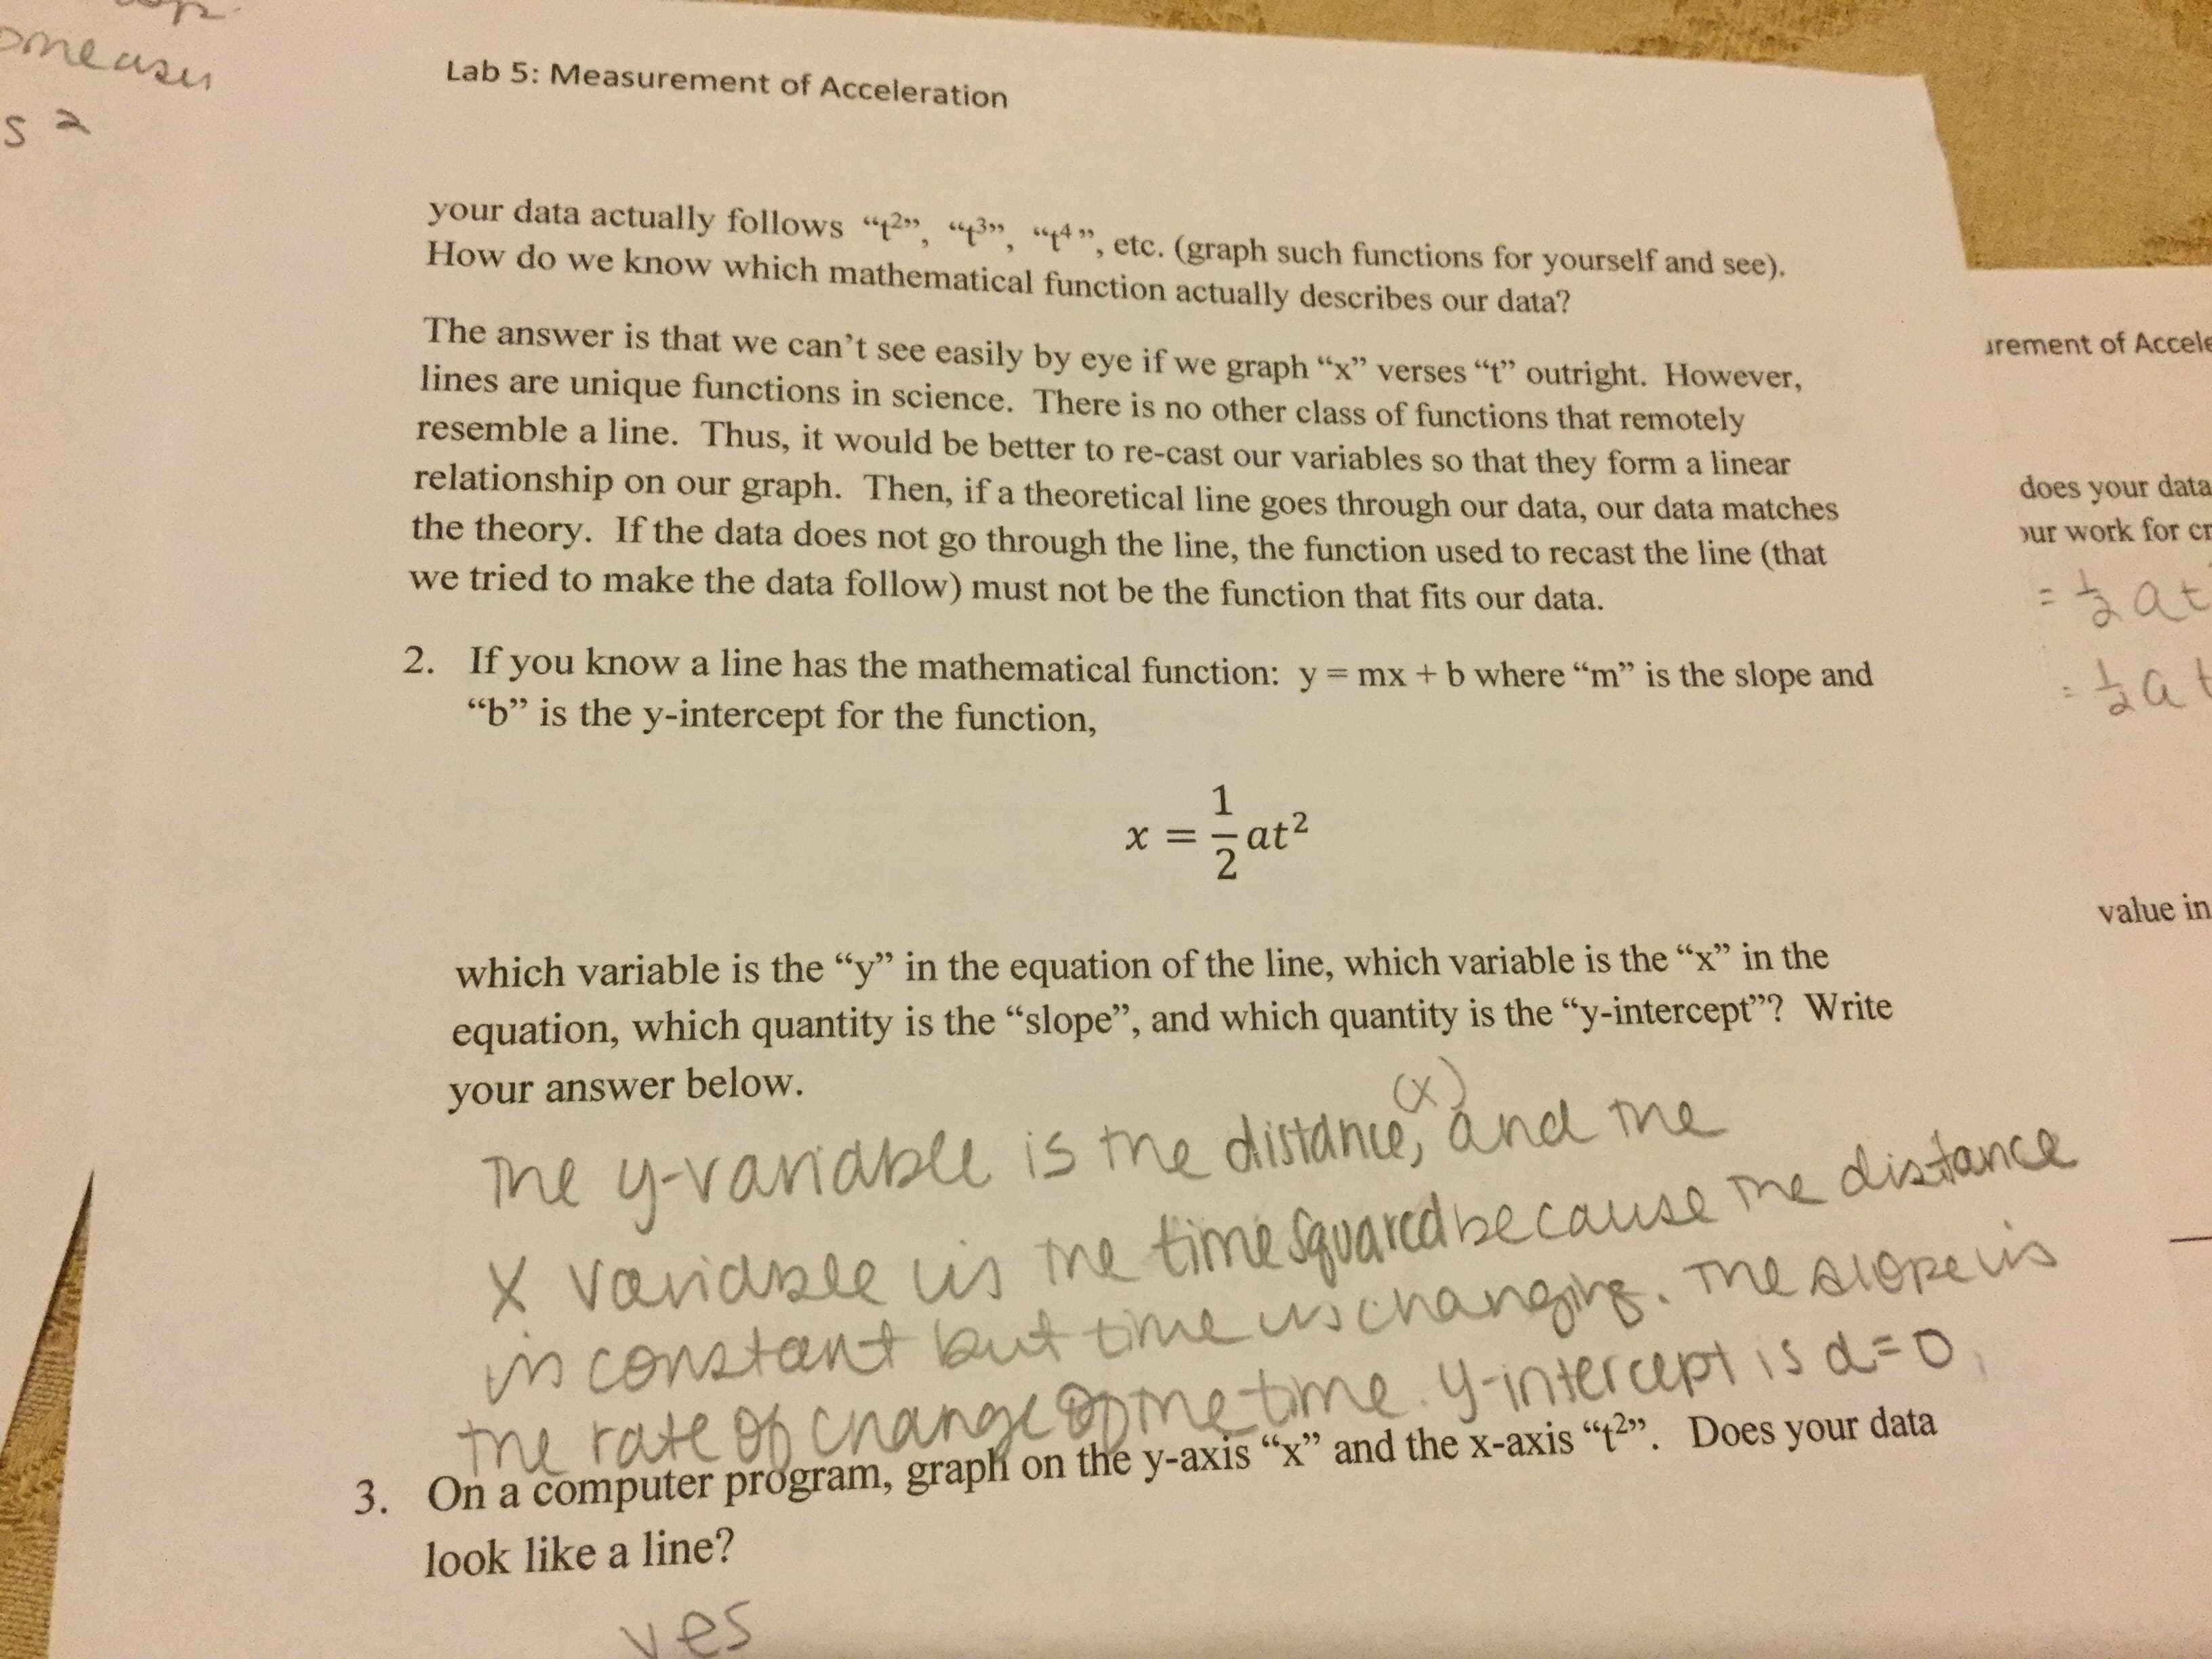
your data actually follows "t", "t", "t4", etc. (graph such functions for yourself and see).
How do we know which mathematical function actually describes our data?
The answer is that we can't see easily by eye if we graph "x" verses "t" outright. However,
lines are unique functions in science. There is no other class of functions that remotely
resemble a line. Thus, it would be better to re-cast our variables so that they form a linear
rement of Accele
relationship
the theory. If the data does not go through the line, the function used to recast the line (that
we tried to make the data follow) must not be the function that fits our data.
on our graph. Then, if a theoretical line goes through our data, our data matches
does your data
ur work for cr
at
If you know a line has the mathematical function: y = mx + b where "m" is the slope and
2.
at
"b" is the y-intercept for the function,
1
х
2at2
value in
which variable is the "y" in the equation of the line, which variable is the "x" in the
equation, which quantity is the "slope", and which quantity is the "y-intercept"? Write
y-vanabu is me disiane, dnd ne
X Vandale un tre timesquarcdhecause me dintaunce
your answer below.
Tne
TL rate en enangpmetime yintercupt is d-o
On a computer program, grapí on the y-axis "x" and the x-axis "t. Does your data
M cemtant leut timeuschangs Tme AIOReus
3.
look like a line?
Yes
Transcribed Image Text:Lab 5: Measurement of Acceleration
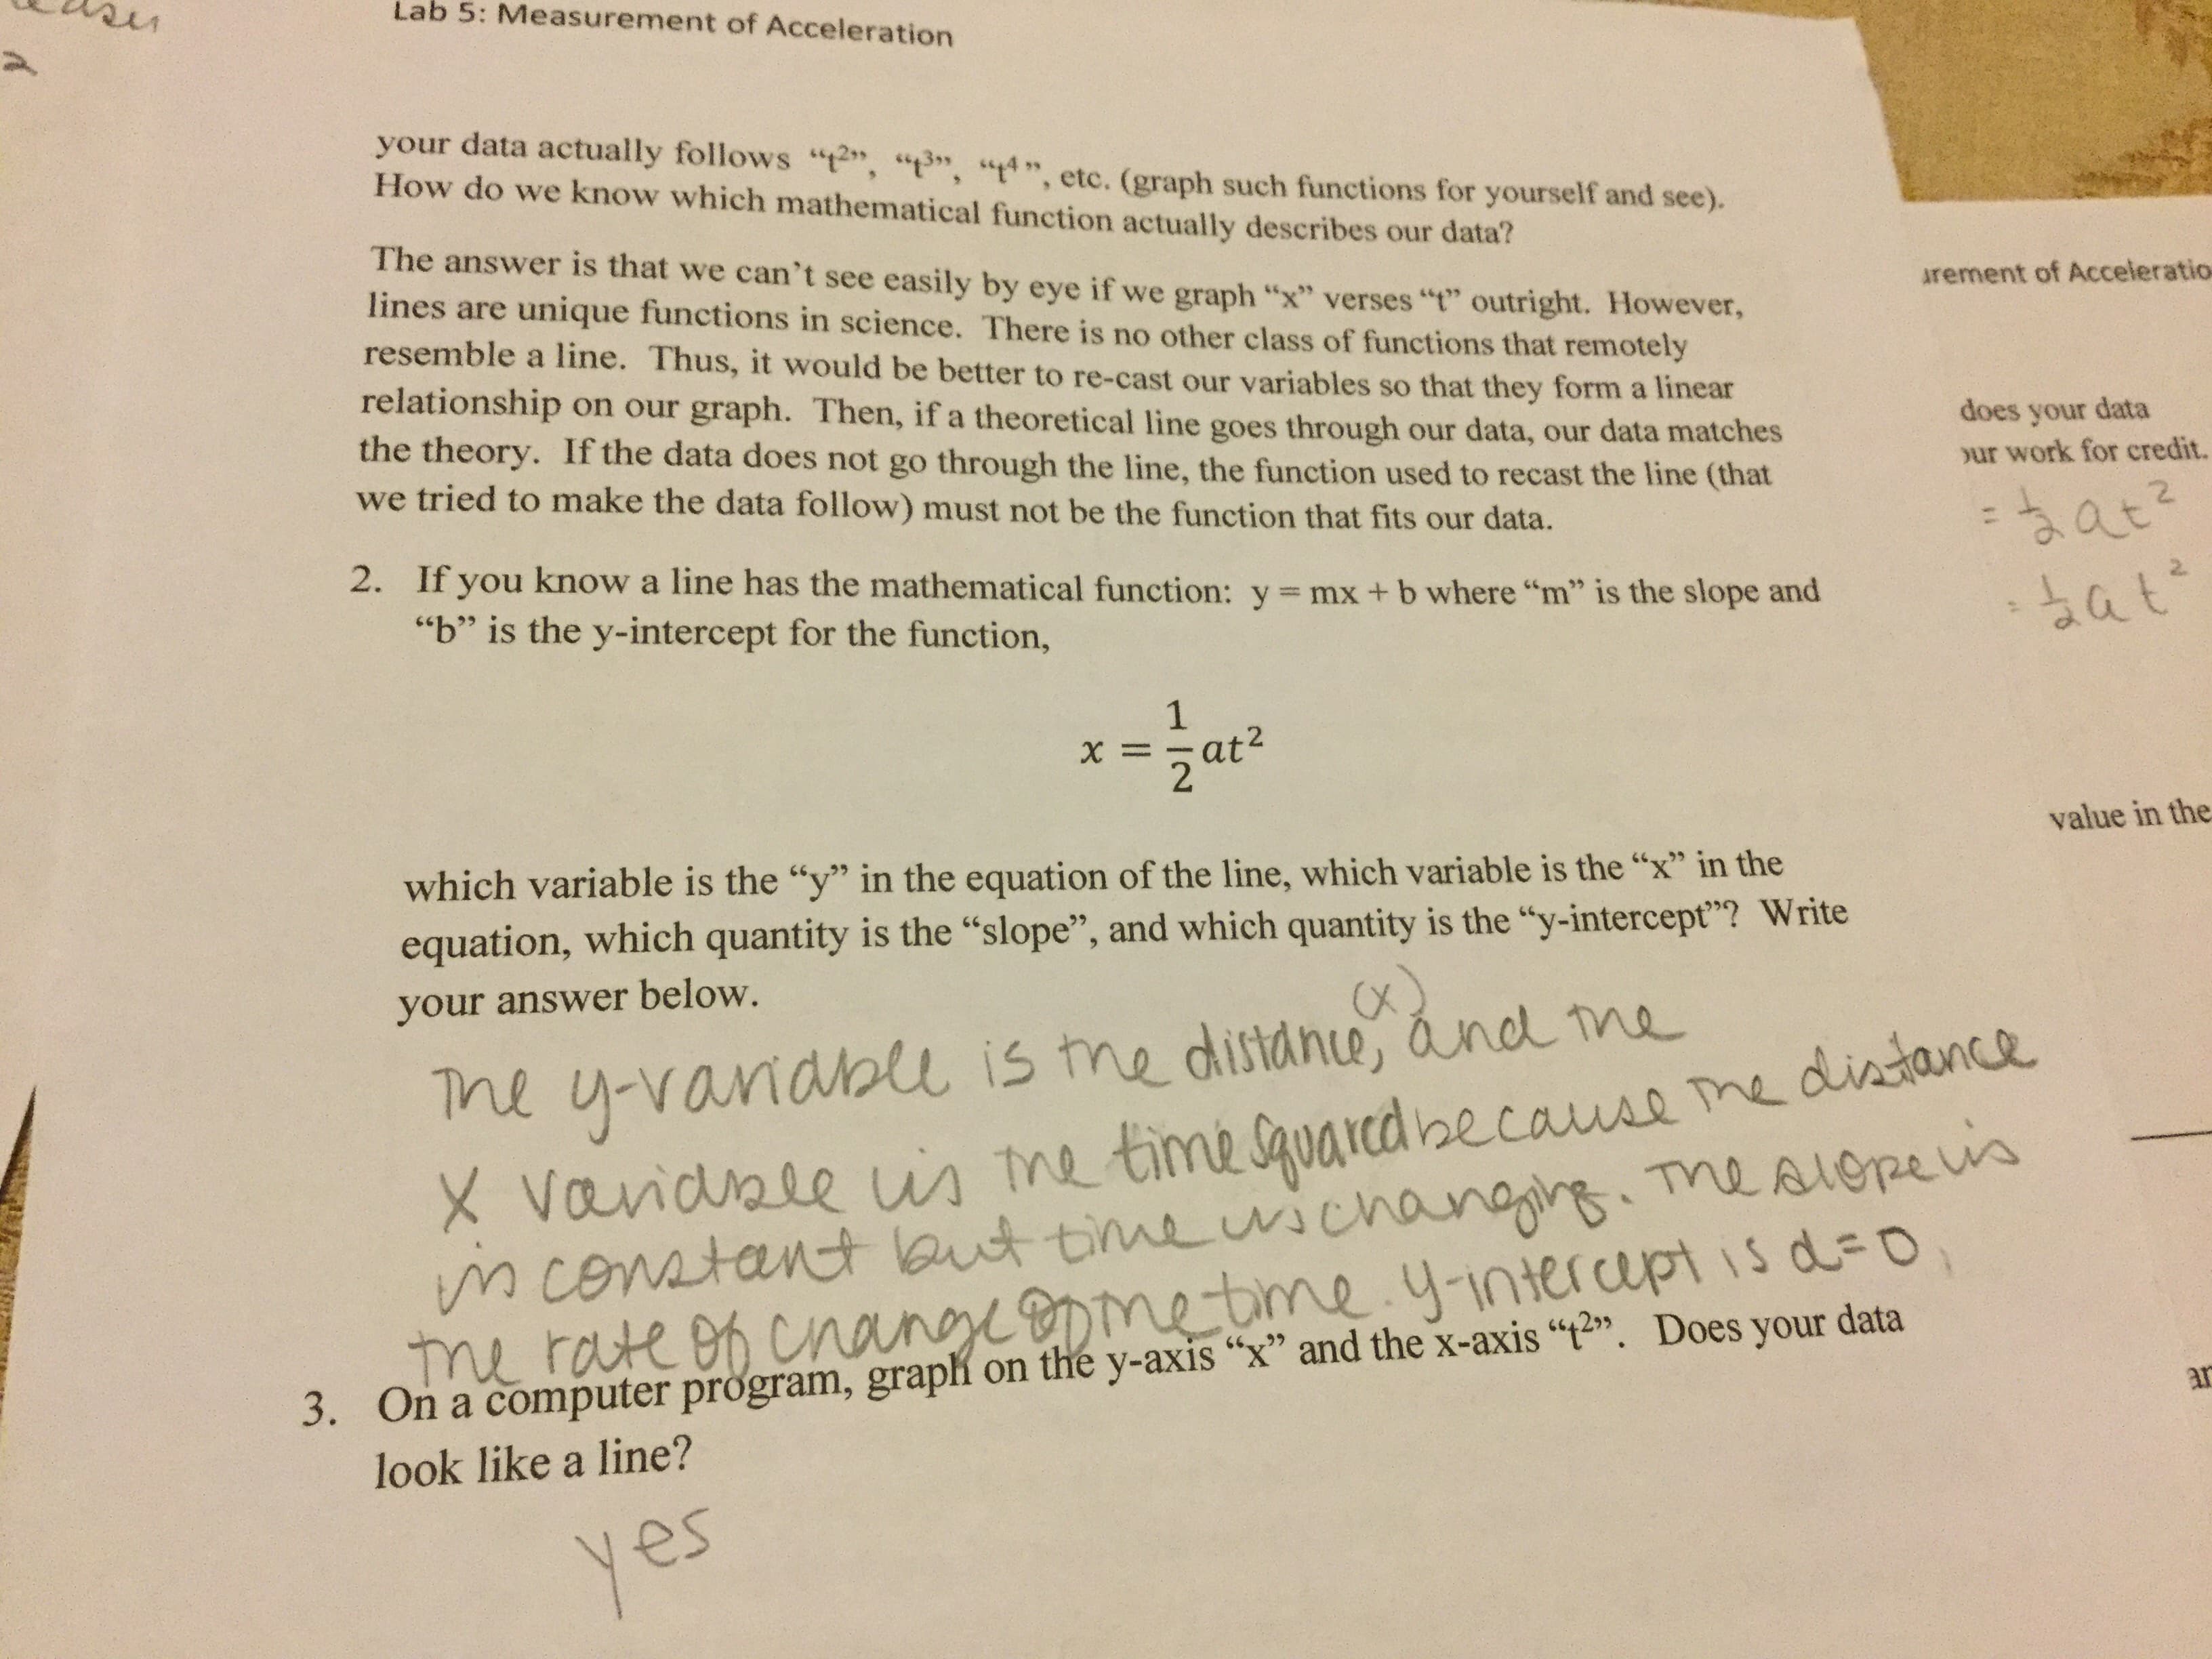
your data actually follows "t", "t3", "4",etc. (graph such functions for yourself and see).
How do we know which mathematical function actually describes our data?
The answer is that we can't see easily by eye if we graph "x" verses "t" outright. However,
lines are unique functions in science. There is no other class of functions that remotely
resemble a line. Thus, it would be better to re-cast our variables so that they form a linear
Arement of Acceleratio
relationship
the theory. If the data does not go through the line, the function used to recast the line (that
we tried to make the data follow) must not be the function that fits our data.
on our graph. Then, if a theoretical line goes through our data, our data matches
does your data
ur work for credit.
atz
2
2.
If you know a line has the mathematical function: y = mx + b where "m" is the slope and
"b" is the y-intercept for the function,
at
1
2at2
value in the
which variable is the "y" in the equation of the line, which variable is the "x" in the
equation, which quantity is the "slope", and which quantity is the "y-intercept? Write
your answer below.
ne y-vanaolu
X Vanidale un me timesauarcd ecause me dintaunce
is tme distane, dnd me
S cemstant leut timewchanagi Tma AIOpes
raute eh Cnangepmetime.yintercupt is d-o
T
3. On a computer program, graph on the y-axis "x" and the x-axis "t. Does your data
look like a line?
ar
yes
Expert Solution
This question has been solved!
Explore an expertly crafted, step-by-step solution for a thorough understanding of key concepts.

This is a popular solution!

Trending now
This is a popular solution!

Step by step
Solved in 3 steps with 2 images

Knowledge Booster


Learn more about
Need a deep-dive on the concept behind this application? Look no further. Learn more about this topic, physics and related others by exploring similar questions and additional content below.Recommended textbooks for you
College Physics
Physics
ISBN:
9781938168000
Author:
Paul Peter Urone, Roger Hinrichs
Publisher:
OpenStax College

An Introduction to Physical Science
Physics
ISBN:
9781305079137
Author:
James Shipman, Jerry D. Wilson, Charles A. Higgins, Omar Torres
Publisher:
Cengage Learning
College Physics
Physics
ISBN:
9781938168000
Author:
Paul Peter Urone, Roger Hinrichs
Publisher:
OpenStax College
An Introduction to Physical Science
Physics
ISBN:
9781305079137
Author:
James Shipman, Jerry D. Wilson, Charles A. Higgins, Omar Torres
Publisher:
Cengage Learning