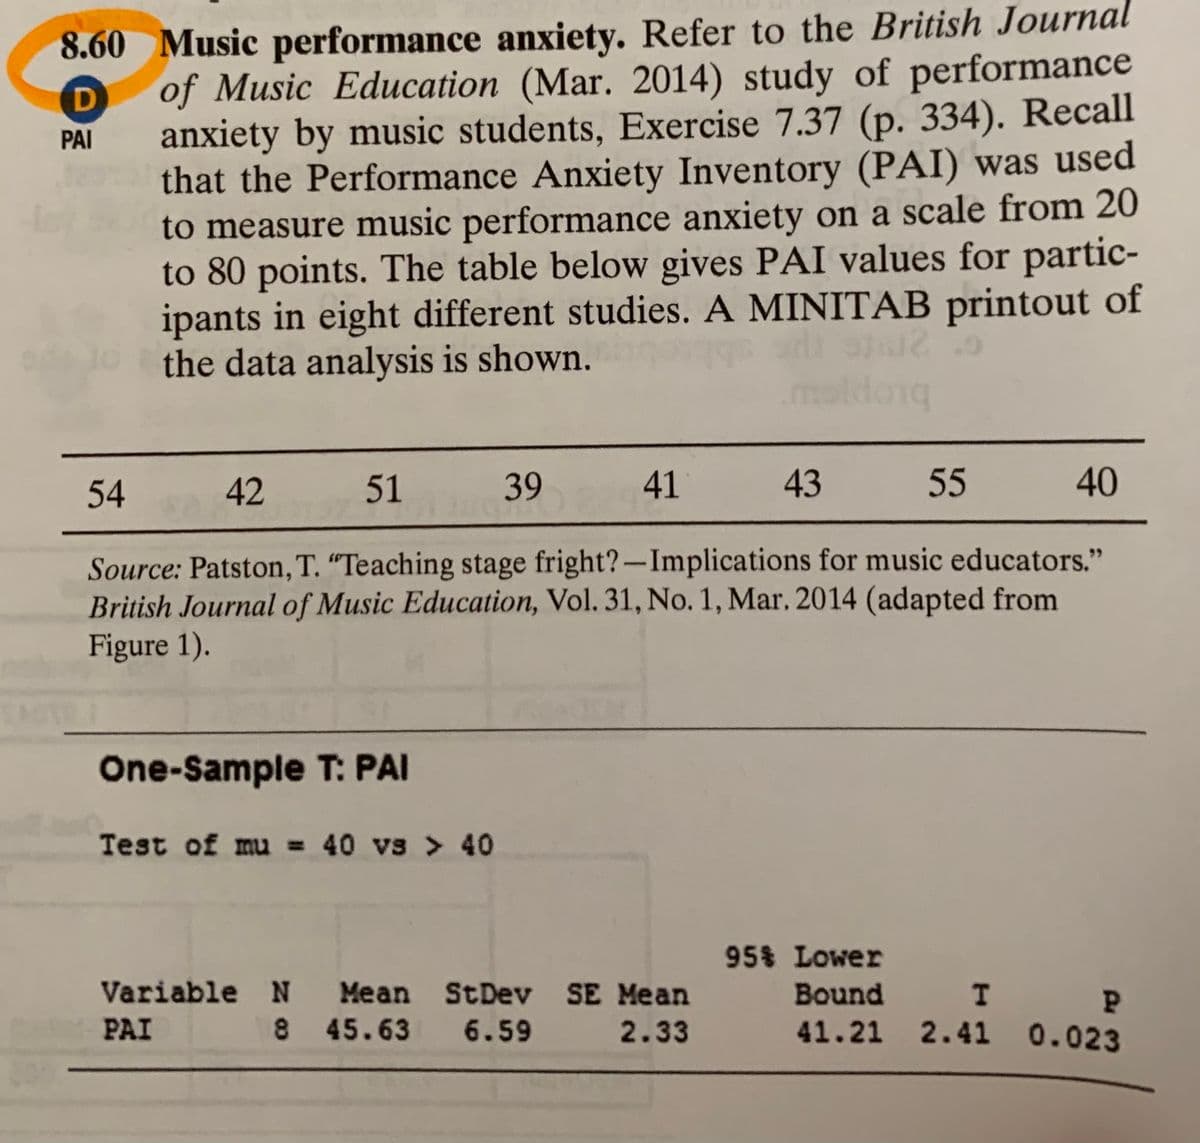
Music performance anxiety. Refer to the British of Music Education (Mar. 2014) study of performance anxiety by music students, Exercise 7.37 (p. 334). Recall that the Performance Anxiety Inventory (PAI) was used to measure music performance anxiety on a scale from 20 to 80 points. The table below gives PAI values for partic- ipants in eight different studies. A MINITAB printout of
Music performance anxiety. Refer to the British of Music Education (Mar. 2014) study of performance anxiety by music students, Exercise 7.37 (p. 334). Recall that the Performance Anxiety Inventory (PAI) was used to measure music performance anxiety on a scale from 20 to 80 points. The table below gives PAI values for partic- ipants in eight different studies. A MINITAB printout of

Glencoe Algebra 1, Student Edition, 9780079039897, 0079039898, 2018
18th Edition
ISBN:9780079039897
Author:Carter
Publisher:Carter
Chapter10: Statistics
Section10.3: Measures Of Spread
Problem 1GP

Related questions
Question
Please solve for all parts
Transcribed Image Text:8.60 Music performance anxiety. Refer to the British Journal
of Music Education (Mar. 2014) study of performance
D
anxiety by music students, Exercise 7.37 (p. 334). Recall
that the Performance Anxiety Inventory (PAI) was used
to measure music performance anxiety on a scale from 20
to 80 points. The table below gives PAI values for partic-
ipants in eight different studies. A MINITAB printout of
the data analysis is shown.
PAI
maldong
54
42
51
39
41
43
55 40
Source: Patston, T. “Teaching stage fright?-Implications for music educators."
British Journal of Music Education, Vol. 31, No. 1, Mar. 2014 (adapted from
Figure 1).
One-Sample T: PAI
Test of mu = 40 vs > 40
95% Lower
Bound I P
41.21 2.41 0.023
Variable N Mean StDev SE Mean
PAI
8 45.63 6.59
2.33
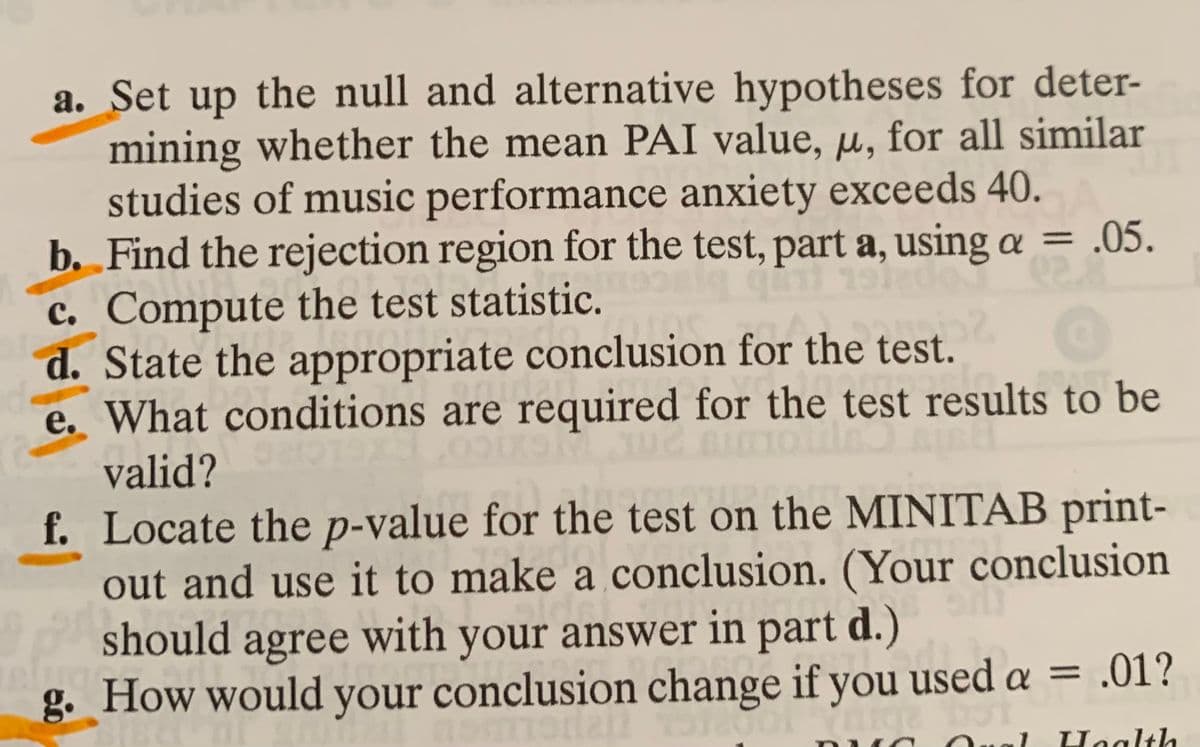
Transcribed Image Text:a. Set up the null and alternative hypotheses for deter-
mining whether the mean PAI value, u, for all similar
studies of music performance anxiety exceeds 40.
b. Find the rejection region for the test, part a, using a = .05.
%3D
c. Compute the test statistic.
d. State the appropriate conclusion for the test.
e. What conditions are required for the test results to be
valid?
f. Locate the p-value for the test on the MINITAB print-
out and use it to make a conclusion. (Your conclusion
should agree with
g. How would your conclusion change if you used a =
your answer in part d.)
= .01?
ual
Haalth
Expert Solution
This question has been solved!
Explore an expertly crafted, step-by-step solution for a thorough understanding of key concepts.

This is a popular solution!

Trending now
This is a popular solution!

Step by step
Solved in 2 steps with 1 images

Knowledge Booster


Learn more about
Need a deep-dive on the concept behind this application? Look no further. Learn more about this topic, statistics and related others by exploring similar questions and additional content below.Recommended textbooks for you
Glencoe Algebra 1, Student Edition, 9780079039897…
Algebra
ISBN:
9780079039897
Author:
Carter
Publisher:
McGraw Hill
Glencoe Algebra 1, Student Edition, 9780079039897…
Algebra
ISBN:
9780079039897
Author:
Carter
Publisher:
McGraw Hill