My Drive - Google Drive GA random sample of 100 COS X O Math 21 Final Fall 2009 In Person Final Users/chasejamescanterbury/Dropbox/Online%20Final%20Exam%20F19.pdf 1. A random sample of 100 COS students produced the following results concerning food preferences. Mexican Chinese Italian 30 18 12 Males 10 17 13 Females At the 0.05 level, test the claim that food preference is independent of gender. p-value: 0.0424) (Test Stat: 6.32 Step 1 Ho: H1: Step 2 Step 3 Test: Step 4 Test Stat = P-value Step 5 Но. There is /is NOT sufficient evidence to conclude that.. Have you proved that there is a relation between food preference and gender? MacBook Air 20 F3 F1 F2 F4 F5 F6 >II F8 F7 F9 %23 %24 F10 F11 F12 & 4. ) 8. 9. E Y + II
My Drive - Google Drive GA random sample of 100 COS X O Math 21 Final Fall 2009 In Person Final Users/chasejamescanterbury/Dropbox/Online%20Final%20Exam%20F19.pdf 1. A random sample of 100 COS students produced the following results concerning food preferences. Mexican Chinese Italian 30 18 12 Males 10 17 13 Females At the 0.05 level, test the claim that food preference is independent of gender. p-value: 0.0424) (Test Stat: 6.32 Step 1 Ho: H1: Step 2 Step 3 Test: Step 4 Test Stat = P-value Step 5 Но. There is /is NOT sufficient evidence to conclude that.. Have you proved that there is a relation between food preference and gender? MacBook Air 20 F3 F1 F2 F4 F5 F6 >II F8 F7 F9 %23 %24 F10 F11 F12 & 4. ) 8. 9. E Y + II

Holt Mcdougal Larson Pre-algebra: Student Edition 2012
1st Edition
ISBN:9780547587776
Author:HOLT MCDOUGAL
Publisher:HOLT MCDOUGAL
Chapter11: Data Analysis And Probability
Section: Chapter Questions
Problem 8CR

Related questions
Question
Solves all steps of question one.
Transcribed Image Text:My Drive - Google Drive
GA random sample of 100 COS X
O Math 21 Final Fall 2009
In Person Final
Users/chasejamescanterbury/Dropbox/Online%20Final%20Exam%20F19.pdf
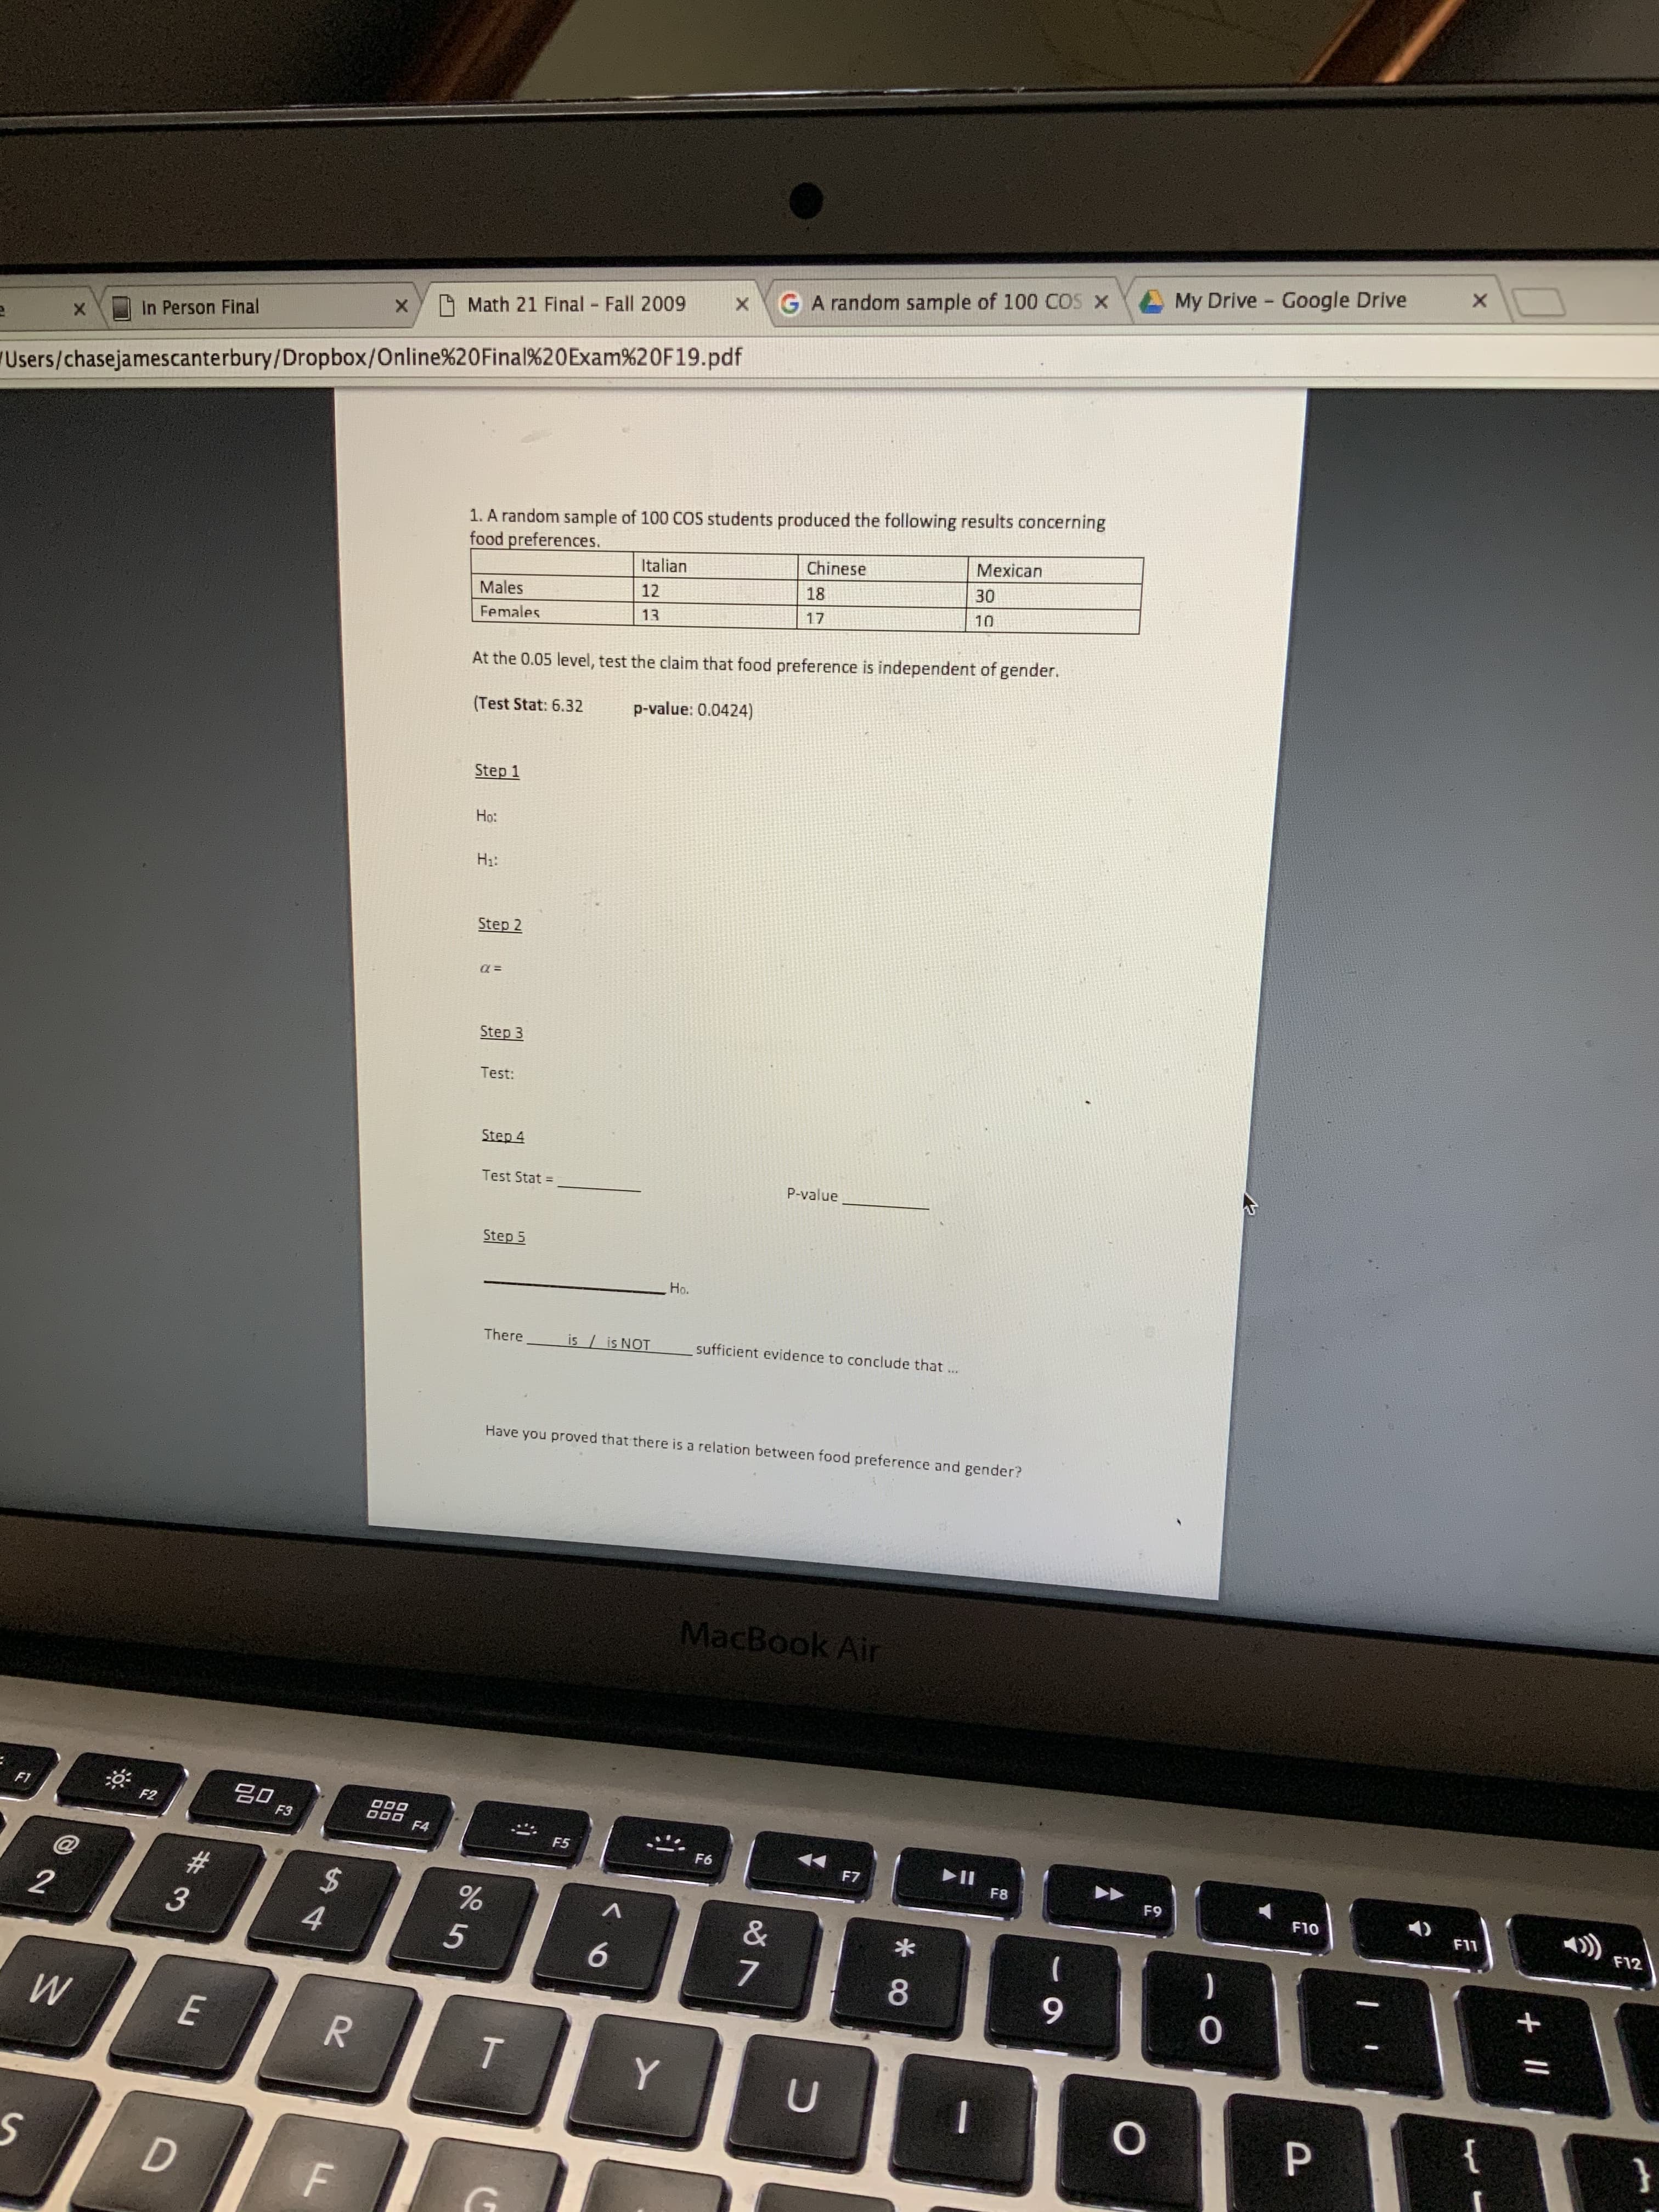
1. A random sample of 100 COS students produced the following results concerning
food preferences.
Mexican
Chinese
Italian
30
18
12
Males
10
17
13
Females
At the 0.05 level, test the claim that food preference is independent of gender.
p-value: 0.0424)
(Test Stat: 6.32
Step 1
Ho:
H1:
Step 2
Step 3
Test:
Step 4
Test Stat =
P-value
Step 5
Но.
There
is /is NOT
sufficient evidence to conclude that..
Have you proved that there is a relation between food preference and gender?
MacBook Air
20
F3
F1
F2
F4
F5
F6
>II
F8
F7
F9
%23
%24
F10
F11
F12
&
4.
)
8.
9.
E
Y
+ II
Expert Solution
This question has been solved!
Explore an expertly crafted, step-by-step solution for a thorough understanding of key concepts.

This is a popular solution!

Trending now
This is a popular solution!

Step by step
Solved in 7 steps with 5 images

Knowledge Booster


Learn more about
Need a deep-dive on the concept behind this application? Look no further. Learn more about this topic, statistics and related others by exploring similar questions and additional content below.Recommended textbooks for you
Holt Mcdougal Larson Pre-algebra: Student Edition…
Algebra
ISBN:
9780547587776
Author:
HOLT MCDOUGAL
Publisher:
HOLT MCDOUGAL

Algebra & Trigonometry with Analytic Geometry
Algebra
ISBN:
9781133382119
Author:
Swokowski
Publisher:
Cengage
Holt Mcdougal Larson Pre-algebra: Student Edition…
Algebra
ISBN:
9780547587776
Author:
HOLT MCDOUGAL
Publisher:
HOLT MCDOUGAL
Algebra & Trigonometry with Analytic Geometry
Algebra
ISBN:
9781133382119
Author:
Swokowski
Publisher:
Cengage