n-335 35 (153431.1 ont see 3. A crossover trial is planned to evaluate the impact of an educational intervention program to reduce alcohol consumption in patients determined to be at risk for alcohol problems. The pla is to measure alcohol consumption (the number of drinks on a typical drinking day) before the intervention and then again after participants complete the educational intervention program How many articipantswouldberequiredtoen urethata95%,confidencen terval for the mean- difference in the number of drinks is within 2 drinks of the true mean difference? Assume that the standard deviation of the difference in the mean number of drinks is 6.7 drinks. 乙 z- o P8. 172- 173 乙 43. Page 1 of1
n-335 35 (153431.1 ont see 3. A crossover trial is planned to evaluate the impact of an educational intervention program to reduce alcohol consumption in patients determined to be at risk for alcohol problems. The pla is to measure alcohol consumption (the number of drinks on a typical drinking day) before the intervention and then again after participants complete the educational intervention program How many articipantswouldberequiredtoen urethata95%,confidencen terval for the mean- difference in the number of drinks is within 2 drinks of the true mean difference? Assume that the standard deviation of the difference in the mean number of drinks is 6.7 drinks. 乙 z- o P8. 172- 173 乙 43. Page 1 of1

Holt Mcdougal Larson Pre-algebra: Student Edition 2012
1st Edition
ISBN:9780547587776
Author:HOLT MCDOUGAL
Publisher:HOLT MCDOUGAL
Chapter11: Data Analysis And Probability
Section: Chapter Questions
Problem 8CR

Related questions
Topic Video
Question
Please let me know if I calculated the number of participants required for the crossover trial study. It is #3 of my homework. Thank you.
Transcribed Image Text:n-335
35 (153431.1
ont see
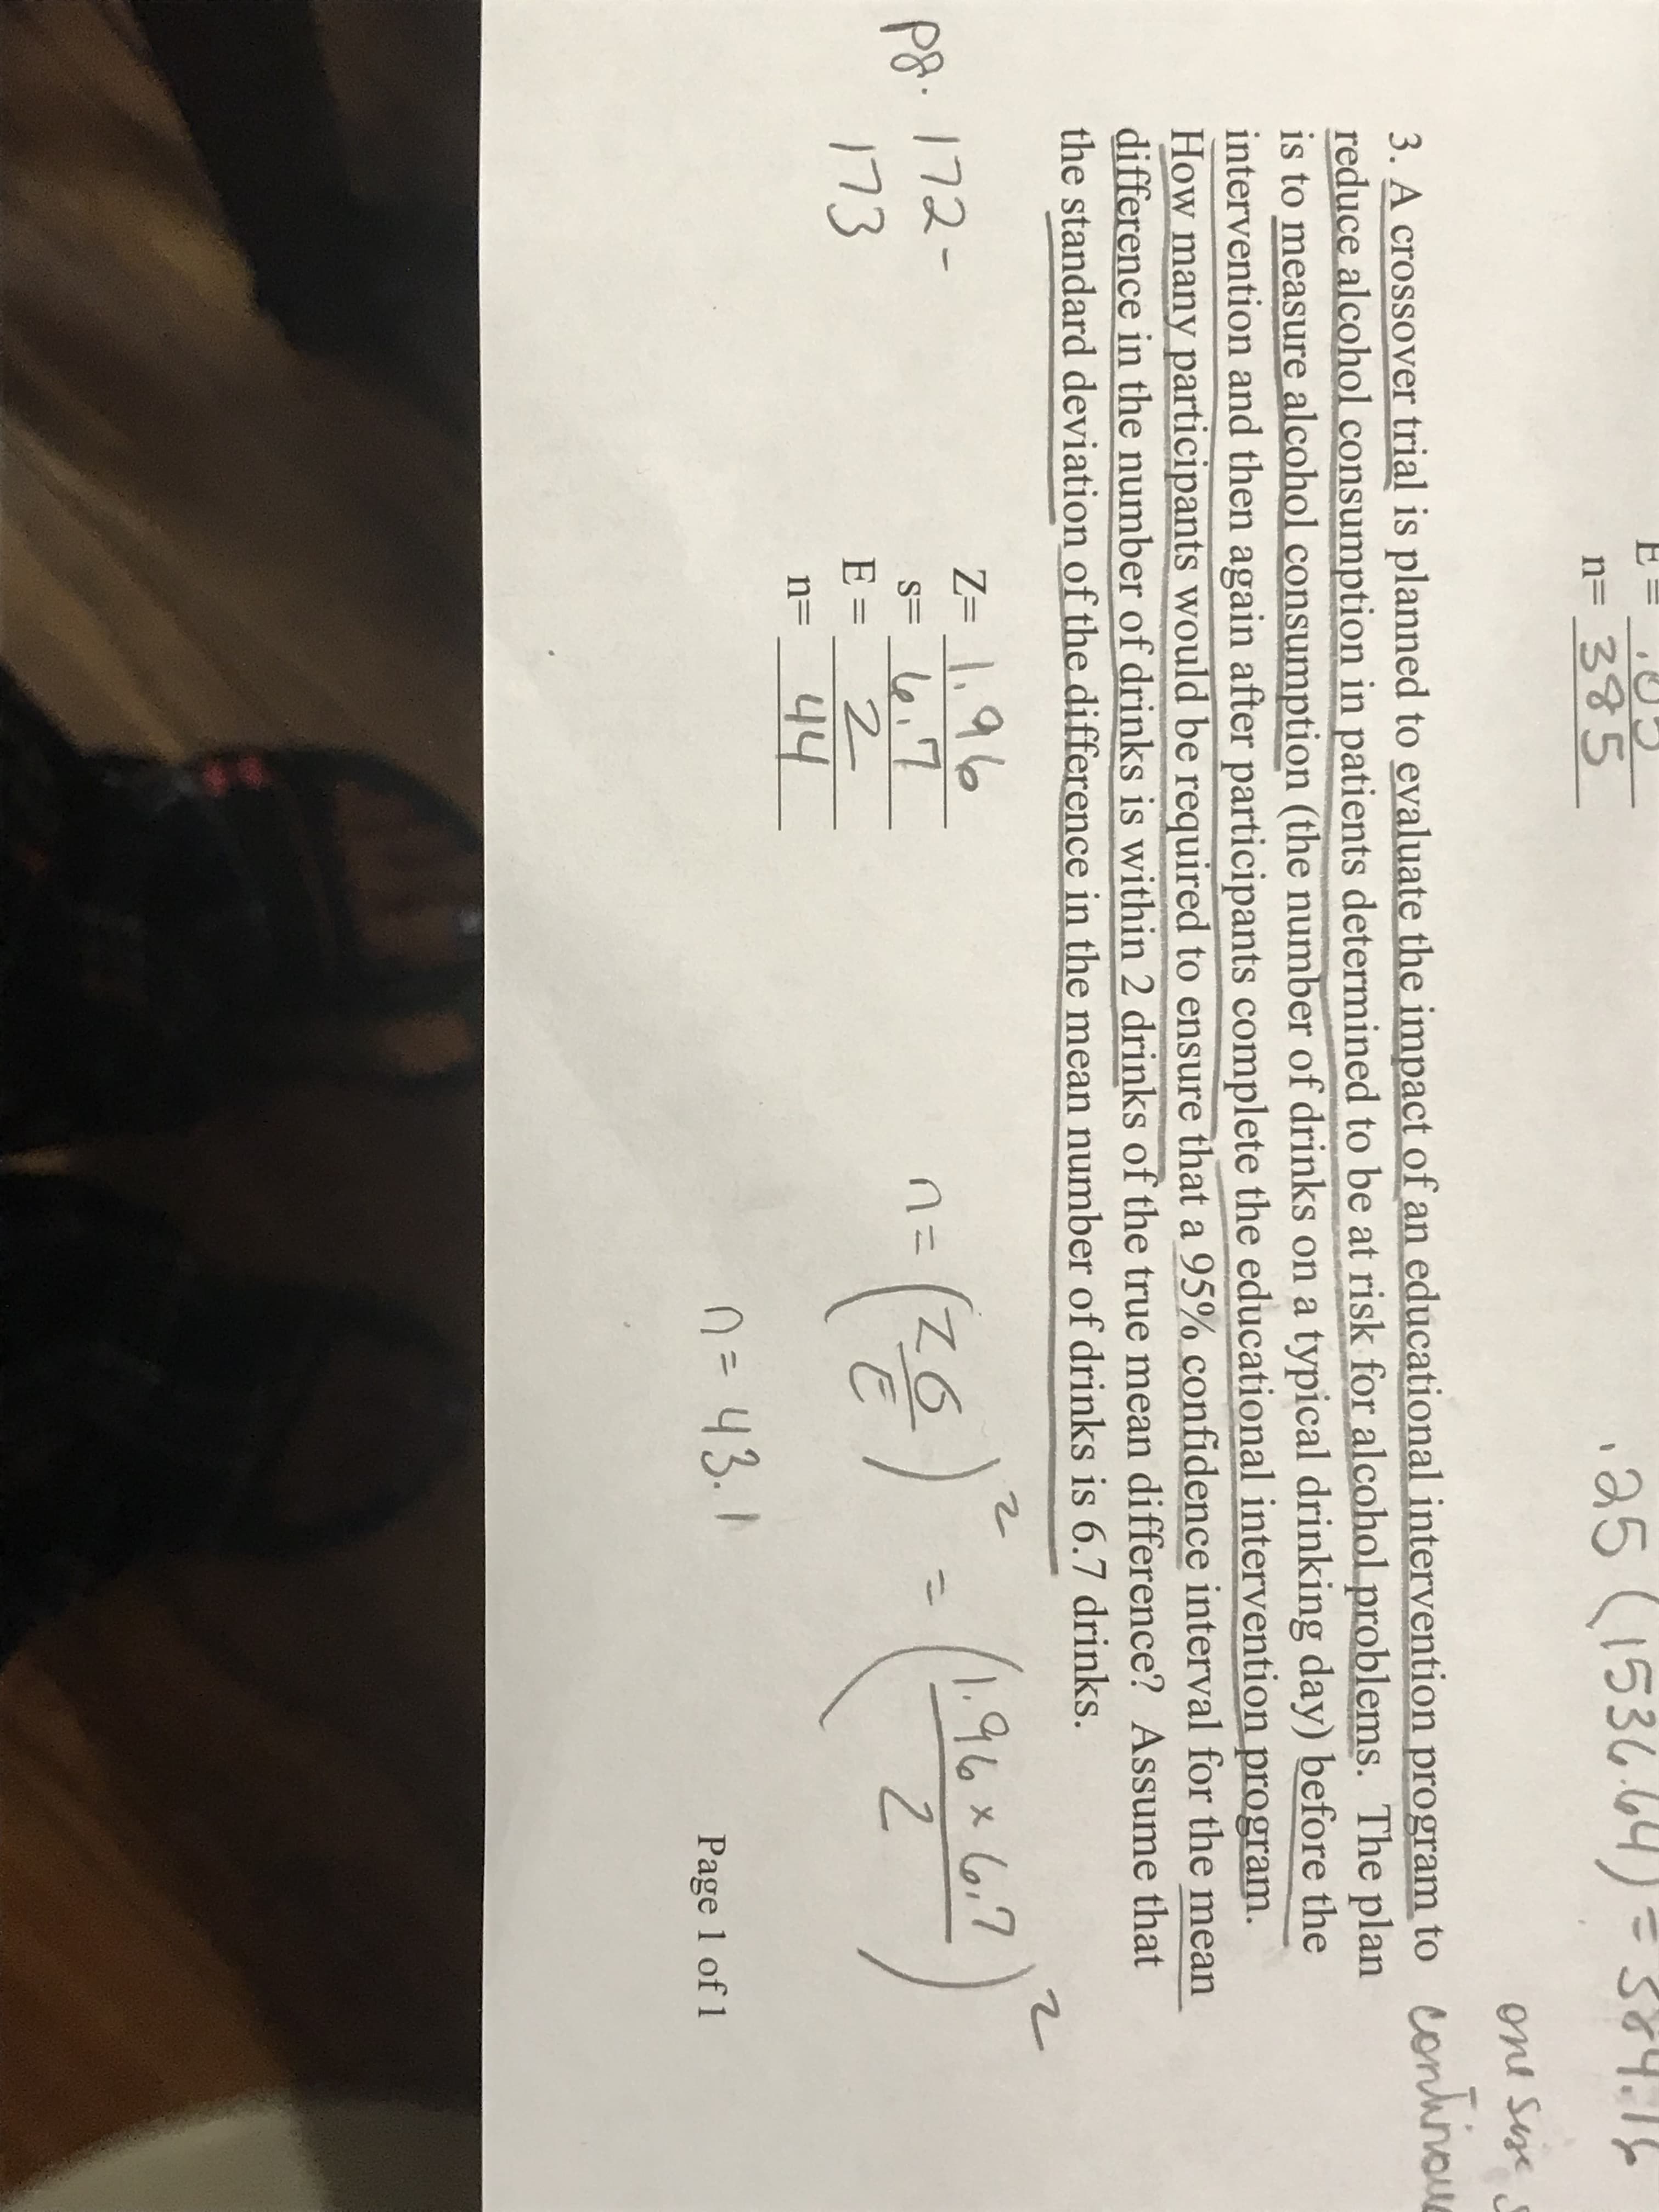
3. A crossover trial is planned to evaluate the impact of an educational intervention program to
reduce alcohol consumption in patients determined to be at risk for alcohol problems. The pla
is to measure alcohol consumption (the number of drinks on a typical drinking day) before the
intervention and then again after participants complete the educational intervention program
How many articipantswouldberequiredtoen urethata95%,confidencen terval for the mean-
difference in the number of drinks is within 2 drinks of the true mean difference? Assume that
the standard deviation of the difference in the mean number of drinks is 6.7 drinks.
乙
z- o
P8. 172-
173
乙
43.
Page 1 of1
Expert Solution
This question has been solved!
Explore an expertly crafted, step-by-step solution for a thorough understanding of key concepts.

This is a popular solution!

Trending now
This is a popular solution!

Step by step
Solved in 4 steps with 2 images

Knowledge Booster


Learn more about
Need a deep-dive on the concept behind this application? Look no further. Learn more about this topic, statistics and related others by exploring similar questions and additional content below.Recommended textbooks for you
Holt Mcdougal Larson Pre-algebra: Student Edition…
Algebra
ISBN:
9780547587776
Author:
HOLT MCDOUGAL
Publisher:
HOLT MCDOUGAL

Holt Mcdougal Larson Pre-algebra: Student Edition…
Algebra
ISBN:
9780547587776
Author:
HOLT MCDOUGAL
Publisher:
HOLT MCDOUGAL