Namas PN. Date Rating PART 1: Define/ Laplain/Descibe the folloning Termi/Phrases 1. Statistics 2. Statistic G. Populotion 7. Sample 11. Ol Square test 12. Kendall Coeffident of Concordance W 11. Spearman ho 9. Wilcoron Mann Whitnry U-test 14. Pearon r 15. t dntribution 3. Infarantial Statistics 4. Descriptive Statistics 5. Nominal Data a. Level of ugniflcance 10. Slovin's Formula
Namas PN. Date Rating PART 1: Define/ Laplain/Descibe the folloning Termi/Phrases 1. Statistics 2. Statistic G. Populotion 7. Sample 11. Ol Square test 12. Kendall Coeffident of Concordance W 11. Spearman ho 9. Wilcoron Mann Whitnry U-test 14. Pearon r 15. t dntribution 3. Infarantial Statistics 4. Descriptive Statistics 5. Nominal Data a. Level of ugniflcance 10. Slovin's Formula

Glencoe Algebra 1, Student Edition, 9780079039897, 0079039898, 2018
18th Edition
ISBN:9780079039897
Author:Carter
Publisher:Carter
Chapter4: Equations Of Linear Functions
Section: Chapter Questions
Problem 8SGR

Related questions
Question
Part 1
7, 8, 9
Transcribed Image Text:Namas
PIL.
Date
Rating.
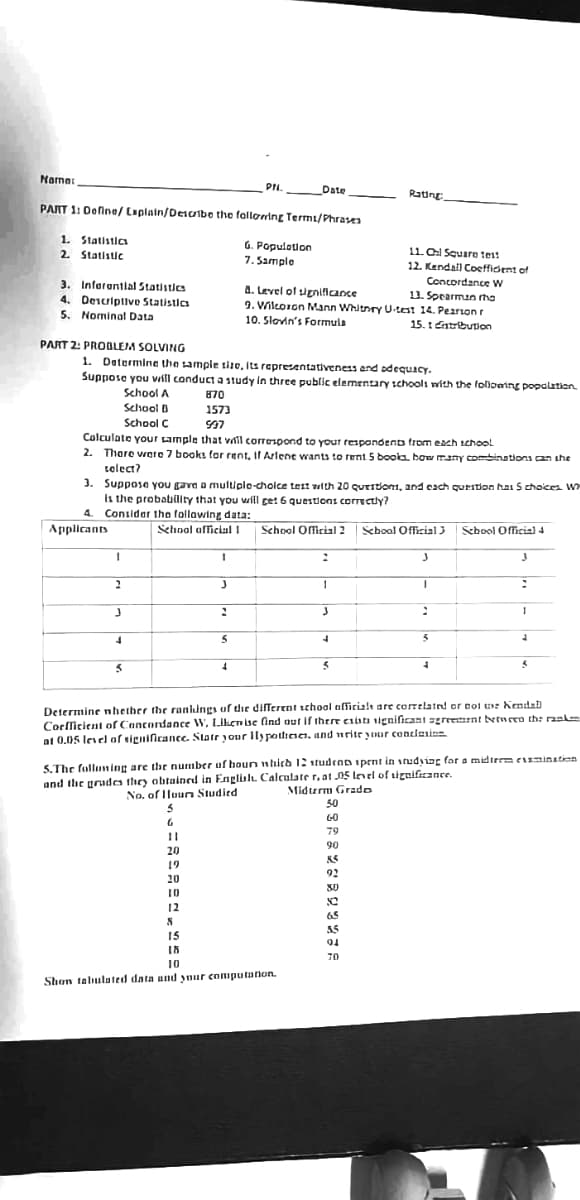
PART 1: Define/ Eaplain/Desaibe the folloợring Termi/Phrase
1. Statistics
2 Statistic
G. Populotion
7. Sample
11Ol Scuare test
12. Kendall Coeffident of
3. Inforantial Statistics
4. Dencriplive Statistics
5. Nominal Data
Concordance w
11. Spearman ha
9. Vilcoron Mann Whitnry U-test 14. Pearon r
a. Level of ugnificance
10. Slovin's Formula
15. t dntribution
PART 2: PROOLEM SOLVING
1. Datormine the sample tize, Its representativeness end odequacy.
Suppose you will conduct a study in three public elementary schooli with the folloeing popalation.
School A
870
Selhool B
School C
1573
Calculate your sample that will corrospond to your respondento trom each iehool
2. Thare were 7 books for rent, If Arlene wants to rent 5 booka. bow many combinations can she
telect?
3. Supposa you (ava o multiplo-cholce test walth 20 quetrtioni, and cach question hai S choices w
Is the probability that you will get 6 questions corectly?
4. Consider the follawing data:
Applicants
Sehoal aficial I
School Official 2
School Official 3
School Official 4
5
Determine nhether the ranlings of dhe different school afficialt are corrtlated or eot ne Kendal
Corllicient of Cancondance W, Llhen se find out if therr esatn significant agrremrnt betneen the raak
0.05 lesel of signiicance. Statr your Ily pothnn, and nritr ynur conclesinn
5.The folluming are the number uf houn nhich 12 studena ipent in studyiag for a midirrm eminatien
and the grudes they obtained in English Calculate r, at 05 lenel of tignificance.
No. of Ilourn Studied
Midterm Grado
50
60
79
!!
90
20
19
92
20
80
10
12
65
55
IS
70
10
Shon talulated data and ynur conputation.
Expert Solution
This question has been solved!
Explore an expertly crafted, step-by-step solution for a thorough understanding of key concepts.

Step by step
Solved in 2 steps

Recommended textbooks for you
Glencoe Algebra 1, Student Edition, 9780079039897…
Algebra
ISBN:
9780079039897
Author:
Carter
Publisher:
McGraw Hill
Glencoe Algebra 1, Student Edition, 9780079039897…
Algebra
ISBN:
9780079039897
Author:
Carter
Publisher:
McGraw Hill