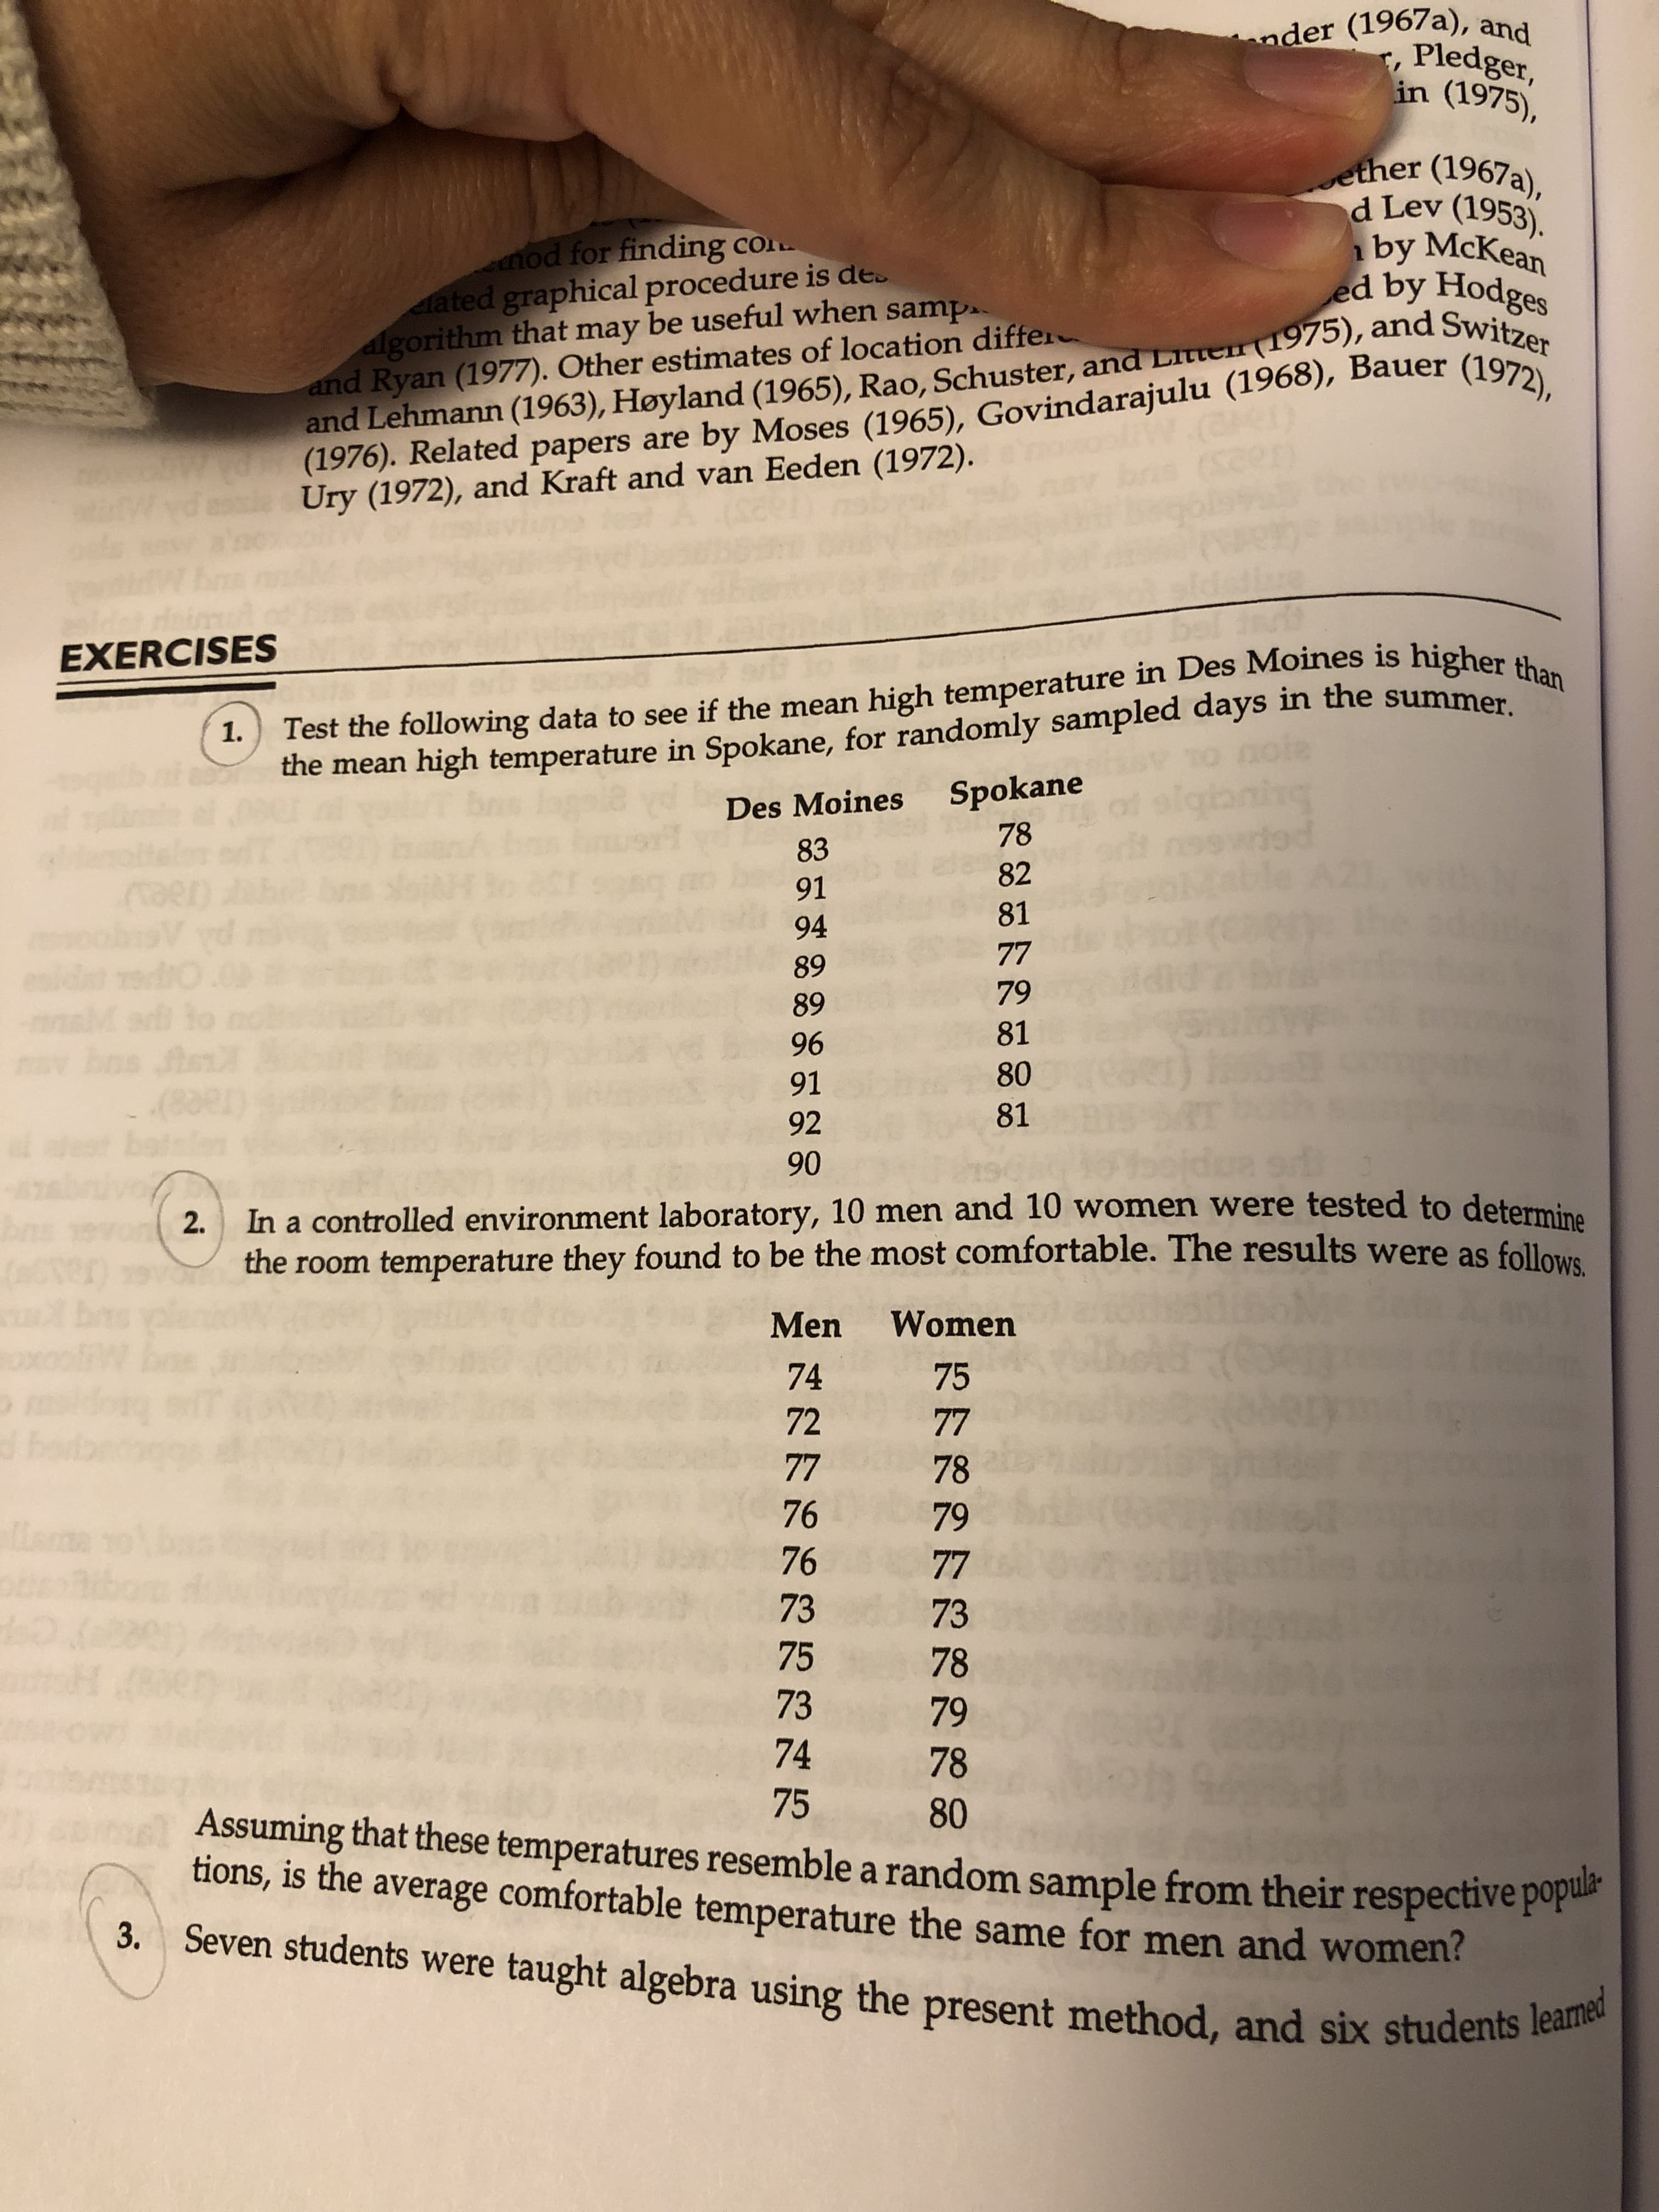
nder (1967a), and r Pledger, in (1975), ether (1967a), d Lev (1953). by McKean ed by Hodges od for finding co lated graphical procedure is de lgorithm that may and Lehmann (1963), Høyland (1965), Rao, Schuster, and Litteir(1975), and Switzer (1976). Related papers are by Moses (1965), Govindarajulu (1968), Bauer (1972), Ury (1972), and Kraft and van Eeden (1972) be useful when samp and Ryan (1977). Other estimates of location differ (s EXERCISES the mean high temperature in Spokane, for randomly sampled days in the summer. Des Moines Spokane Test the following data to see if the mean high temperature in Des Moines is higher than 1. 9 of si 09 78 83 82 91 e: d 81 94 77 89 79 89 to 81 96 mv bos Aum)l 80 91 81 92 90 In a controlled environment laboratory, 10 men and 10 women were tested to determine 2 the room temperature they found to be the most comfortable. The results were as follows ns (8 Men Women ox 75 74 72 77 77 78 76 79 76 77 73 73 75 78 73 79 74 78 75 80 Assuming that these temperatures resemble a random sample from their respective popula tions, is the average comfortable temperature the same for men and women? 3. Seven students were taught algebra using the present method, and six students learned
nder (1967a), and r Pledger, in (1975), ether (1967a), d Lev (1953). by McKean ed by Hodges od for finding co lated graphical procedure is de lgorithm that may and Lehmann (1963), Høyland (1965), Rao, Schuster, and Litteir(1975), and Switzer (1976). Related papers are by Moses (1965), Govindarajulu (1968), Bauer (1972), Ury (1972), and Kraft and van Eeden (1972) be useful when samp and Ryan (1977). Other estimates of location differ (s EXERCISES the mean high temperature in Spokane, for randomly sampled days in the summer. Des Moines Spokane Test the following data to see if the mean high temperature in Des Moines is higher than 1. 9 of si 09 78 83 82 91 e: d 81 94 77 89 79 89 to 81 96 mv bos Aum)l 80 91 81 92 90 In a controlled environment laboratory, 10 men and 10 women were tested to determine 2 the room temperature they found to be the most comfortable. The results were as follows ns (8 Men Women ox 75 74 72 77 77 78 76 79 76 77 73 73 75 78 73 79 74 78 75 80 Assuming that these temperatures resemble a random sample from their respective popula tions, is the average comfortable temperature the same for men and women? 3. Seven students were taught algebra using the present method, and six students learned

Algebra & Trigonometry with Analytic Geometry
13th Edition
ISBN:9781133382119
Author:Swokowski
Publisher:Swokowski
Chapter2: Equations And Inequalities
Section2.4: Complex Numbers
Problem 59E

Related questions

Concept explainers
Contingency Table
A contingency table can be defined as the visual representation of the relationship between two or more categorical variables that can be evaluated and registered. It is a categorical version of the scatterplot, which is used to investigate the linear relationship between two variables. A contingency table is indeed a type of frequency distribution table that displays two variables at the same time.
Binomial Distribution
Binomial is an algebraic expression of the sum or the difference of two terms. Before knowing about binomial distribution, we must know about the binomial theorem.
Topic Video
Question
Question 2 in images
Transcribed Image Text:nder (1967a), and
r Pledger,
in (1975),
ether (1967a),
d Lev (1953).
by McKean
ed by Hodges
od for finding co
lated graphical procedure is de
lgorithm that may
and Lehmann (1963), Høyland (1965), Rao, Schuster, and Litteir(1975), and Switzer
(1976). Related papers are by Moses (1965), Govindarajulu (1968), Bauer (1972),
Ury (1972), and Kraft and van Eeden (1972)
be useful when samp
and Ryan (1977). Other estimates of location differ
(s
EXERCISES
the mean high temperature in Spokane, for randomly sampled days in the summer.
Des Moines Spokane
Test the following data to see if the mean high temperature in Des Moines is higher than
1.
9
of si
09
78
83
82
91
e:
d
81
94
77
89
79
89
to
81
96
mv bos Aum)l
80
91
81
92
90
In a controlled environment laboratory, 10 men and 10 women were tested to determine
2
the room temperature they found to be the most comfortable. The results were as follows
ns
(8
Men Women
ox
75
74
72
77
77
78
76
79
76
77
73
73
75
78
73
79
74
78
75
80
Assuming that these temperatures resemble a random sample from their respective popula
tions, is the average comfortable temperature the same for men and women?
3. Seven students were taught algebra using the present method, and six students learned
Expert Solution
This question has been solved!
Explore an expertly crafted, step-by-step solution for a thorough understanding of key concepts.

This is a popular solution!

Trending now
This is a popular solution!

Step by step
Solved in 5 steps with 2 images

Knowledge Booster


Learn more about
Need a deep-dive on the concept behind this application? Look no further. Learn more about this topic, statistics and related others by exploring similar questions and additional content below.Recommended textbooks for you
Algebra & Trigonometry with Analytic Geometry
Algebra
ISBN:
9781133382119
Author:
Swokowski
Publisher:
Cengage
Algebra & Trigonometry with Analytic Geometry
Algebra
ISBN:
9781133382119
Author:
Swokowski
Publisher:
Cengage