This economy experienced a contraction in the years_________(Choose one of these: 1980-1981, 1981-1985, 1986-1987 or 1987-1988). On the first graph (showing real GDP), this contraction is seen as a period in which the level of real GDP__________(Choose one of these: decreases, is negative or is below the long-term trend line). On the second graph (showing annual change in real GDP), this contraction is seen as a period in which the growth rate of real GDP________(Choose one of these: increases, decreases, is positive or is negative) .
This economy experienced a contraction in the years_________(Choose one of these: 1980-1981, 1981-1985, 1986-1987 or 1987-1988). On the first graph (showing real GDP), this contraction is seen as a period in which the level of real GDP__________(Choose one of these: decreases, is negative or is below the long-term trend line). On the second graph (showing annual change in real GDP), this contraction is seen as a period in which the growth rate of real GDP________(Choose one of these: increases, decreases, is positive or is negative) .

Essentials of Economics (MindTap Course List)
8th Edition
ISBN:9781337091992
Author:N. Gregory Mankiw
Publisher:N. Gregory Mankiw
Chapter15: Measuring A Nation's Income
Section: Chapter Questions
Problem 7PA

Related questions
Question
Need help with this. Start with Part 1 and 2 Screenshots, both are able to be zoomed so you can see them better then answer this question/s down below:
Question/s
This economy experienced a contraction in the years_________(Choose one of these: 1980-1981, 1981-1985, 1986-1987 or 1987-1988). On the first graph (showing real GDP ), this contraction is seen as a period in which the level of real GDP__________(Choose one of these: decreases, is negative or is below the long-term trend line). On the second graph (showing annual change in real GDP), this contraction is seen as a period in which the growth rate of real GDP________(Choose one of these: increases, decreases, is positive or is negative) .
True or False: This economy was experiencing an expansion in 1981.
True
False
In case you decided this is more than 1 question, I agree for you to do the entire thing just let me know what to do.
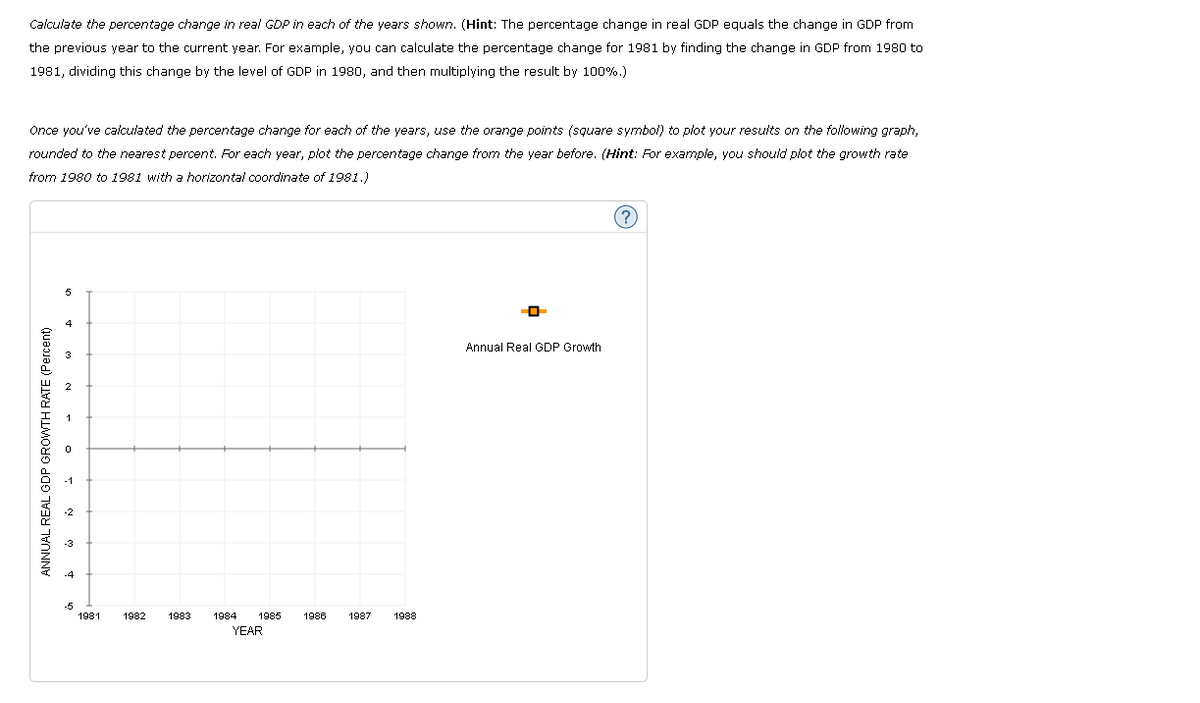
Transcribed Image Text:Calculate the percentage change in real GDP in each of the years shown. (Hint: The percentage change in real GDP equals the change in GDP from
the previous year to the current year. For example, you can calculate the percentage change for 1981 by finding the change in GDP from 1980 to
1981, dividing this change by the level of GDP in 1980, and then multiplying the result by 100%.)
Once you've calculated the percentage change for each of the years, use the orange points (square symbol) to plot your results on the following graph,
rounded to the nearest percent. For each year, plot the percentage change from the year before. (Hint: For example, you should plot the growth rate
from 1980 to 1981 with a horizontal coordinate of 1981.)
ANNUAL REAL GDP GROWTH RATE (Percent)
-5
1981
1982
1983
1984
1985
YEAR
1986 1987 1988
Annual Real GDP Growth
?
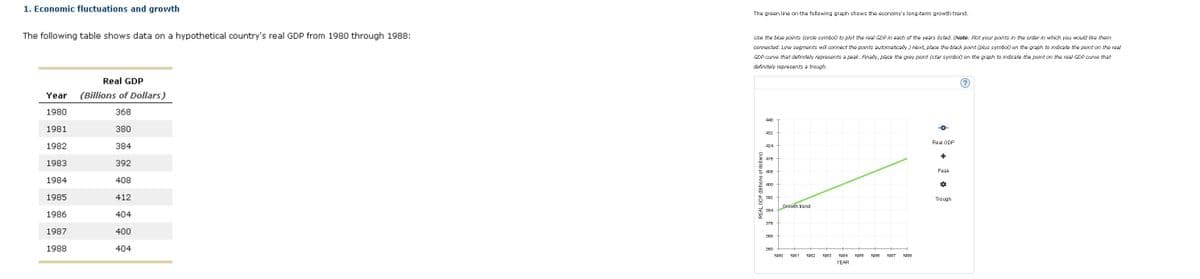
Transcribed Image Text:1. Economic fluctuations and growth
The following table shows data on a hypothetical country's real GDP from 1980 through 1988:
Year
1980
1981
1982
1983
1984
1985
1986
1987
1988
Real GDP
(Billions of Dollars)
368
380
384
392
408
412
404
400
404
The green line on the following graph shows the economy's long-term growth trend.
Use the blue points (circle symbol) to plot the real GDP in each of the years listed. (Note: Plot your points in the order in which you would like them
connected. Line segments will connect the points automatically.) Next, place the black point (plus symbol) on the graph to indicate the point on the real
GDP curve that definitely represents a peak. Finally, place the grey point (star symbol) on the graph to indicate the point on the real GDP curve that
definitely represents a trough.
REAL GDP (Billions of dollars)
440
432
424
416
408
400
392
384
376
368
360
Growth trend
1980
1981 1982
1983 1984 1985 1986 1987 1988
YEAR
-O
Real GDP
+
Peak
Trought
(?)
Expert Solution
This question has been solved!
Explore an expertly crafted, step-by-step solution for a thorough understanding of key concepts.

This is a popular solution!

Trending now
This is a popular solution!

Step by step
Solved in 4 steps with 1 images

Follow-up Questions
Read through expert solutions to related follow-up questions below.
Follow-up Question
Need help with putting the peak and trough.

Transcribed Image Text:REAL GDP (Billions of dollars)
440
432
424
416
408
400
392
384
376
368
360
Growth trend
1980
1981
1982 1983
O
O
O
O
1984 1985 1986 1987
YEAR
O
1988
Real GDP
Peak
☆
Trough
Solution
Knowledge Booster


Learn more about
Need a deep-dive on the concept behind this application? Look no further. Learn more about this topic, economics and related others by exploring similar questions and additional content below.Recommended textbooks for you
Essentials of Economics (MindTap Course List)
Economics
ISBN:
9781337091992
Author:
N. Gregory Mankiw
Publisher:
Cengage Learning

Brief Principles of Macroeconomics (MindTap Cours…
Economics
ISBN:
9781337091985
Author:
N. Gregory Mankiw
Publisher:
Cengage Learning

Economics: Private and Public Choice (MindTap Cou…
Economics
ISBN:
9781305506725
Author:
James D. Gwartney, Richard L. Stroup, Russell S. Sobel, David A. Macpherson
Publisher:
Cengage Learning
Essentials of Economics (MindTap Course List)
Economics
ISBN:
9781337091992
Author:
N. Gregory Mankiw
Publisher:
Cengage Learning
Brief Principles of Macroeconomics (MindTap Cours…
Economics
ISBN:
9781337091985
Author:
N. Gregory Mankiw
Publisher:
Cengage Learning
Economics: Private and Public Choice (MindTap Cou…
Economics
ISBN:
9781305506725
Author:
James D. Gwartney, Richard L. Stroup, Russell S. Sobel, David A. Macpherson
Publisher:
Cengage Learning

Macroeconomics: Private and Public Choice (MindTa…
Economics
ISBN:
9781305506756
Author:
James D. Gwartney, Richard L. Stroup, Russell S. Sobel, David A. Macpherson
Publisher:
Cengage Learning


Principles of Economics 2e
Economics
ISBN:
9781947172364
Author:
Steven A. Greenlaw; David Shapiro
Publisher:
OpenStax