Normal Distributions Example: Delta reports that the average age of their pilots is 42.6 years with a standard deviation of 6.3 years. Assume that the distribution of ages is normally distributed. Draw and label the normal model which describes the ages of Delta pilots. M+l0=42.6+6.3 =48.9 M-lo=42.6- 6.3 = 36. 3 %3D %3D M+20=48.9+6.3 = 55.2 M+30=55.2+6.3 3 61.5 M-20=36.3-6.3 34% З4/. 342 = 30 M-30=30-6.3 68% = 23.7 13.5-1 13.5%. 95% 2.35% 2.35% 0.I57. 0.15% 99.7% Let's rece Standard 50 years is of the in What percentage of Delta pilots is older than 50? Why can we not use the Empirical Rule to arrive at an exact answer to this question? What is the best we can say? How will g the chser then 50 61.5 42.6 36.3 30 23.7 ALL
Normal Distributions Example: Delta reports that the average age of their pilots is 42.6 years with a standard deviation of 6.3 years. Assume that the distribution of ages is normally distributed. Draw and label the normal model which describes the ages of Delta pilots. M+l0=42.6+6.3 =48.9 M-lo=42.6- 6.3 = 36. 3 %3D %3D M+20=48.9+6.3 = 55.2 M+30=55.2+6.3 3 61.5 M-20=36.3-6.3 34% З4/. 342 = 30 M-30=30-6.3 68% = 23.7 13.5-1 13.5%. 95% 2.35% 2.35% 0.I57. 0.15% 99.7% Let's rece Standard 50 years is of the in What percentage of Delta pilots is older than 50? Why can we not use the Empirical Rule to arrive at an exact answer to this question? What is the best we can say? How will g the chser then 50 61.5 42.6 36.3 30 23.7 ALL

MATLAB: An Introduction with Applications
6th Edition
ISBN:9781119256830
Author:Amos Gilat
Publisher:Amos Gilat
Chapter1: Starting With Matlab
Section: Chapter Questions
Problem 1P

Related questions
Question
Transcribed Image Text:Normal Distributions
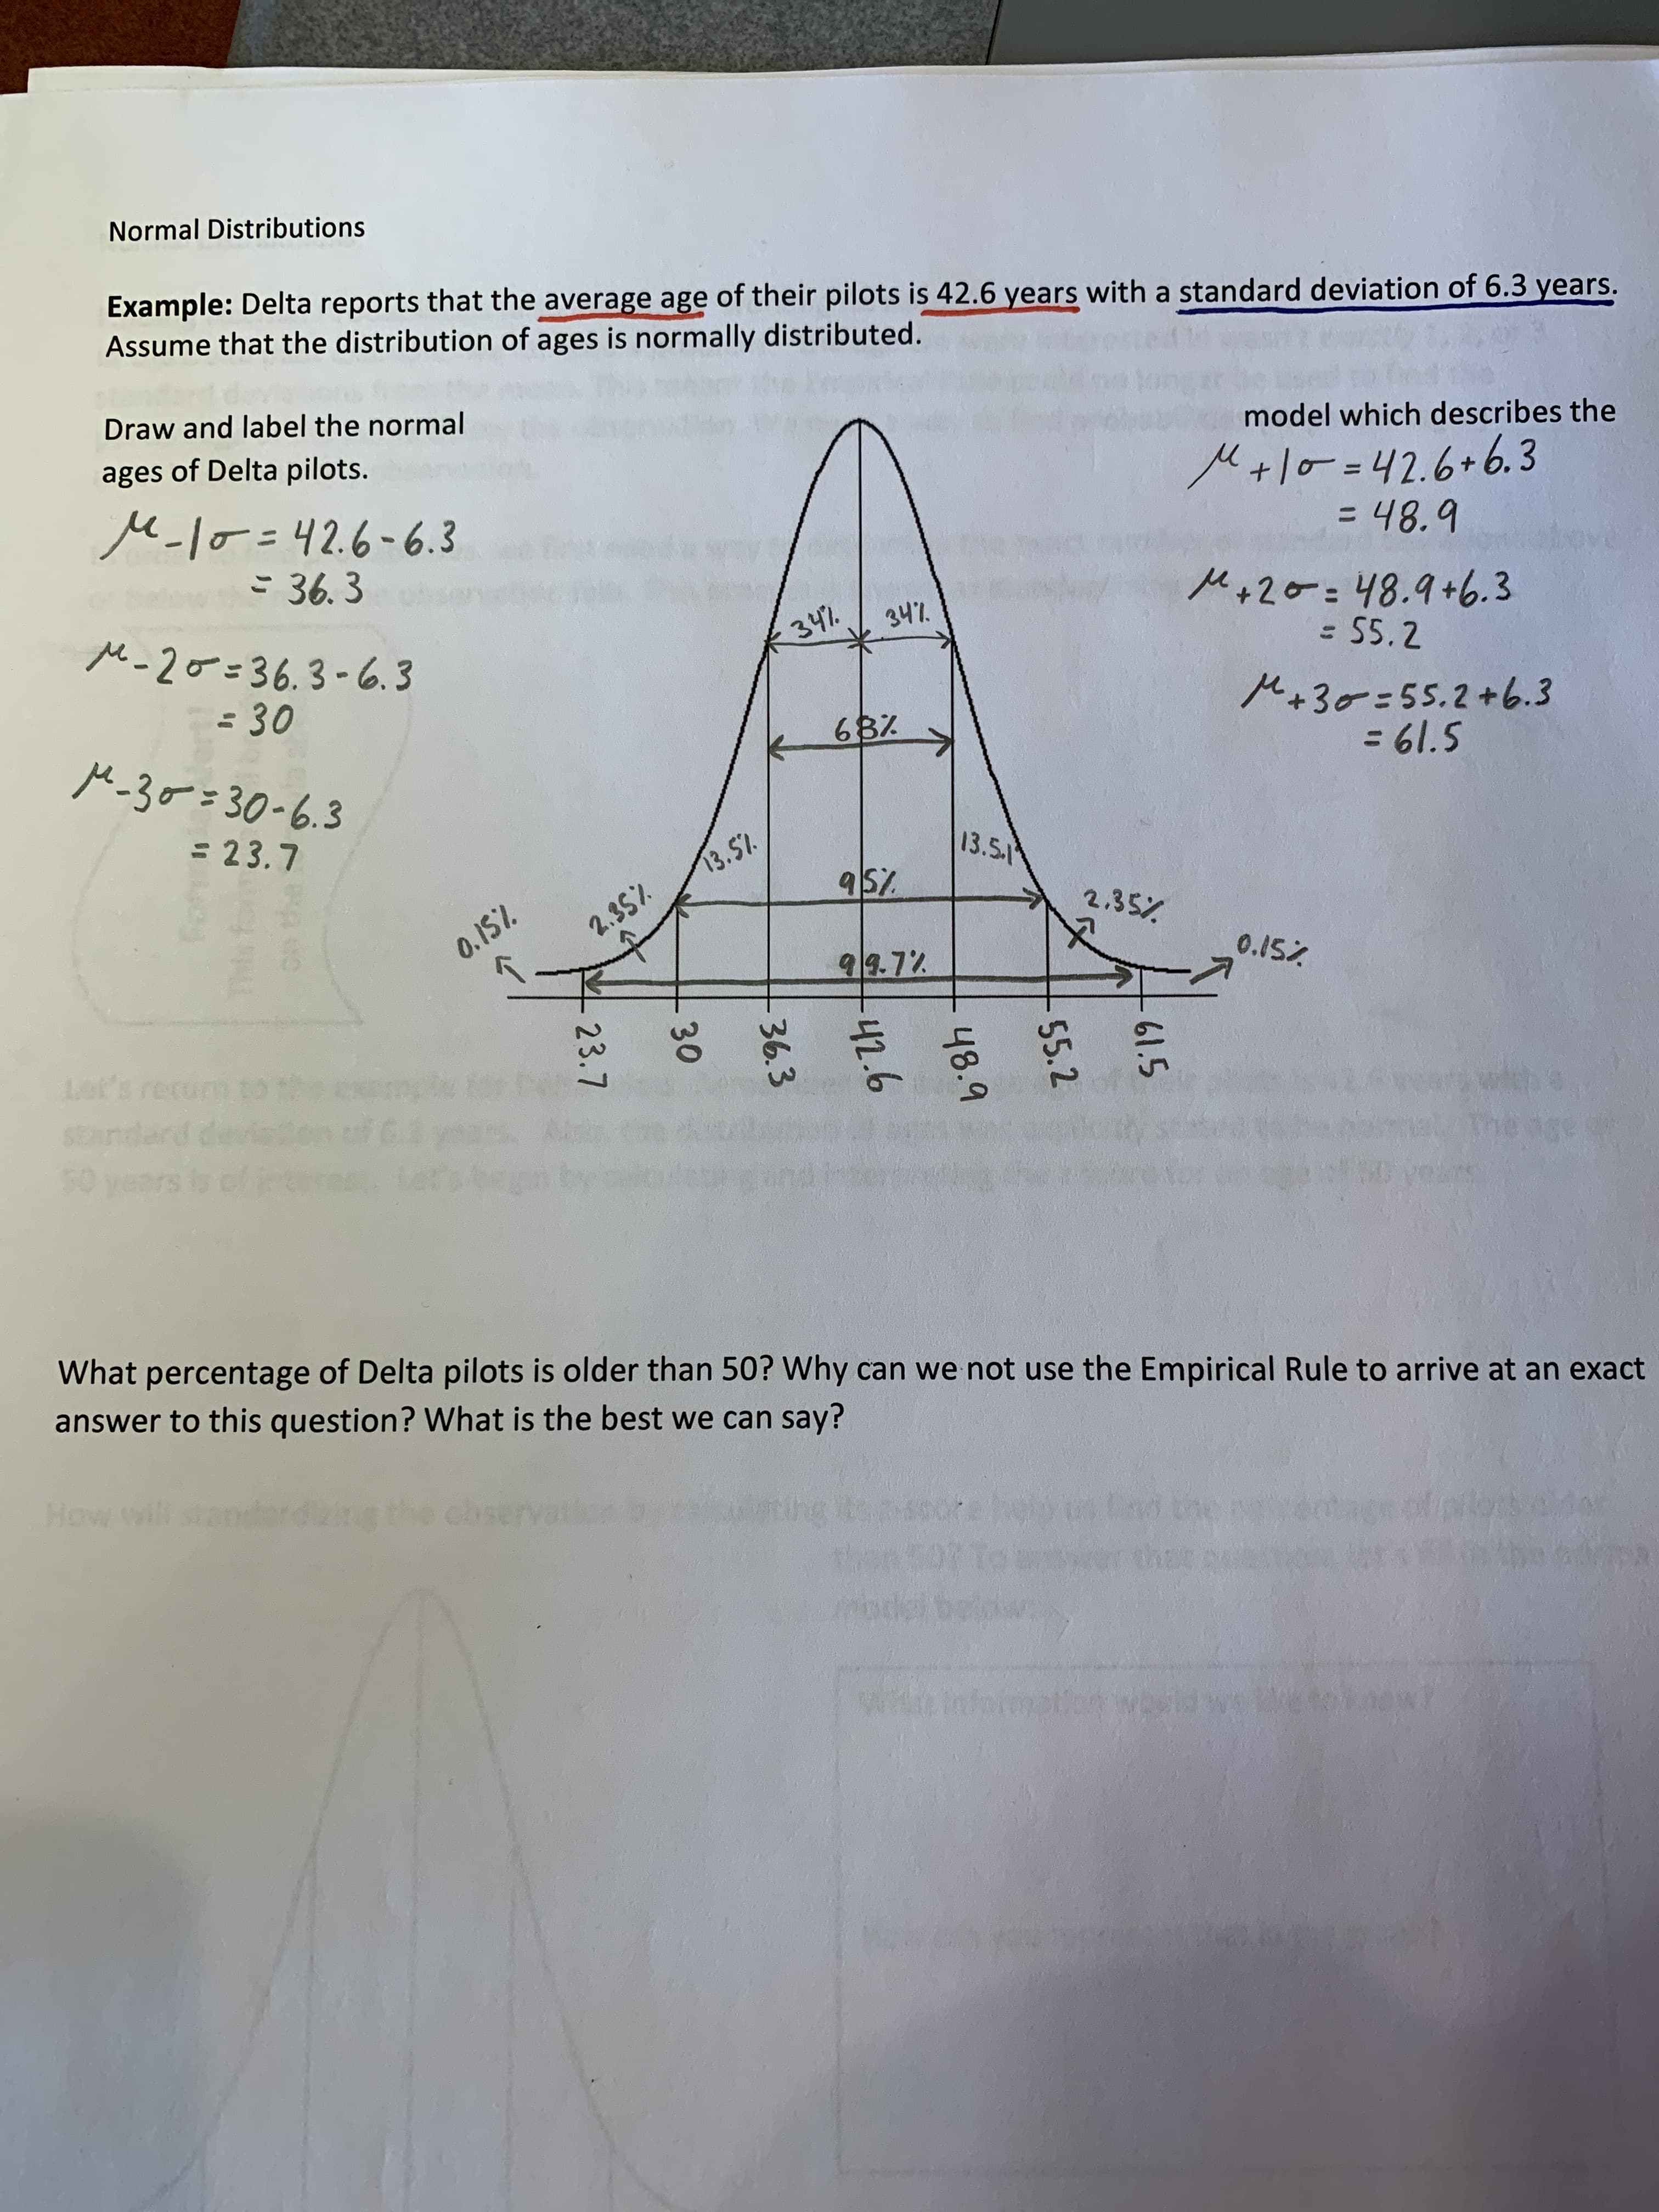
Example: Delta reports that the average age of their pilots is 42.6 years with a standard deviation of 6.3 years.
Assume that the distribution of ages is normally distributed.
Draw and label the normal
model which describes the
ages of Delta pilots.
M+l0=42.6+6.3
=48.9
M-lo=42.6- 6.3
= 36. 3
%3D
%3D
M+20=48.9+6.3
= 55.2
M+30=55.2+6.3
3 61.5
M-20=36.3-6.3
34%
З4/.
342
= 30
M-30=30-6.3
68%
= 23.7
13.5-1
13.5%.
95%
2.35%
2.35%
0.I57.
0.15%
99.7%
Let's rece
Standard
50 years is of
the
in
What percentage of Delta pilots is older than 50? Why can we not use the Empirical Rule to arrive at an exact
answer to this question? What is the best we can say?
How will
g the chser
then 50
61.5
42.6
36.3
30
23.7
ALL
Expert Solution
This question has been solved!
Explore an expertly crafted, step-by-step solution for a thorough understanding of key concepts.

This is a popular solution!

Trending now
This is a popular solution!

Step by step
Solved in 4 steps with 3 images

Recommended textbooks for you
MATLAB: An Introduction with Applications
Statistics
ISBN:
9781119256830
Author:
Amos Gilat
Publisher:
John Wiley & Sons Inc

Probability and Statistics for Engineering and th…
Statistics
ISBN:
9781305251809
Author:
Jay L. Devore
Publisher:
Cengage Learning

Statistics for The Behavioral Sciences (MindTap C…
Statistics
ISBN:
9781305504912
Author:
Frederick J Gravetter, Larry B. Wallnau
Publisher:
Cengage Learning
MATLAB: An Introduction with Applications
Statistics
ISBN:
9781119256830
Author:
Amos Gilat
Publisher:
John Wiley & Sons Inc
Probability and Statistics for Engineering and th…
Statistics
ISBN:
9781305251809
Author:
Jay L. Devore
Publisher:
Cengage Learning
Statistics for The Behavioral Sciences (MindTap C…
Statistics
ISBN:
9781305504912
Author:
Frederick J Gravetter, Larry B. Wallnau
Publisher:
Cengage Learning

Elementary Statistics: Picturing the World (7th E…
Statistics
ISBN:
9780134683416
Author:
Ron Larson, Betsy Farber
Publisher:
PEARSON

The Basic Practice of Statistics
Statistics
ISBN:
9781319042578
Author:
David S. Moore, William I. Notz, Michael A. Fligner
Publisher:
W. H. Freeman

Introduction to the Practice of Statistics
Statistics
ISBN:
9781319013387
Author:
David S. Moore, George P. McCabe, Bruce A. Craig
Publisher:
W. H. Freeman