Now that weddings can be held again you end up being invited to one and you decide to observe the musical taste of the guests. Having observed previous weddings we can assume that each person asks for a dance track with a probability of 0.2, a pop song with a probability of 0.3, a rock song with a probability of 0.15, or a hip hop song with a probability of 0.35. Assume each guest makes one request and all of their requests are made independently. Q14. If you observe 10 guests, the probability that more than 7 of them will choose not to select a pop song is closest to O 0.6496 O 0.1493 0.3828 0.2335 O 0.2668 Q15. If you observe 100 guests, the probability that more than 60 of them will choose not to select a pop song is closest to O 0.7237 O 0.0146 O 0.2763 O 0.9854 O 0.5120
Now that weddings can be held again you end up being invited to one and you decide to observe the musical taste of the guests. Having observed previous weddings we can assume that each person asks for a dance track with a probability of 0.2, a pop song with a probability of 0.3, a rock song with a probability of 0.15, or a hip hop song with a probability of 0.35. Assume each guest makes one request and all of their requests are made independently. Q14. If you observe 10 guests, the probability that more than 7 of them will choose not to select a pop song is closest to O 0.6496 O 0.1493 0.3828 0.2335 O 0.2668 Q15. If you observe 100 guests, the probability that more than 60 of them will choose not to select a pop song is closest to O 0.7237 O 0.0146 O 0.2763 O 0.9854 O 0.5120

College Algebra (MindTap Course List)
12th Edition
ISBN:9781305652231
Author:R. David Gustafson, Jeff Hughes
Publisher:R. David Gustafson, Jeff Hughes
Chapter8: Sequences, Series, And Probability
Section8.7: Probability
Problem 19E: If the spinner shown below is spun, find the probability of each event. Assume that the spinner...

Related questions

Concept explainers
Contingency Table
A contingency table can be defined as the visual representation of the relationship between two or more categorical variables that can be evaluated and registered. It is a categorical version of the scatterplot, which is used to investigate the linear relationship between two variables. A contingency table is indeed a type of frequency distribution table that displays two variables at the same time.
Binomial Distribution
Binomial is an algebraic expression of the sum or the difference of two terms. Before knowing about binomial distribution, we must know about the binomial theorem.
Topic Video
Question
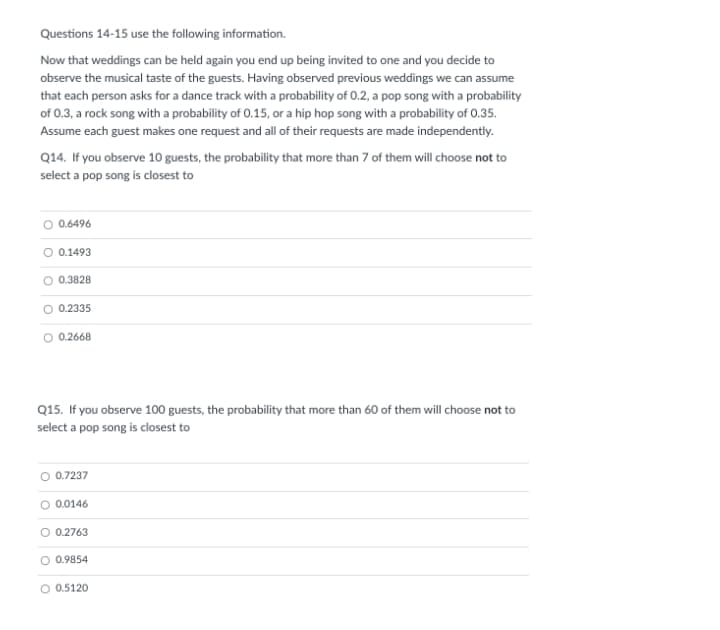
Transcribed Image Text:Questions 14-15 use the following information.
Now that weddings can be held again you end up being invited to one and you decide to
observe the musical taste of the guests. Having observed previous weddings we can assume
that each person asks for a dance track with a probability of 0.2, a pop song with a probability
of 0.3, a rock song with a probability of 0.15, or a hip hop song with a probability of 0.35.
Assume each guest makes one request and all of their requests are made independently.
Q14. If you observe 10 guests, the probability that more than 7 of them will choose not to
select a pop song is closest to
0.6496
O 0.1493
0.3828
0.2335
O 0.2668
Q15. If you observe 100 guests, the probability that more than 60 of them will choose not to
select a pop song is closest to
0.7237
O 0.0146
O 0.2763
O 0.9854
O 0.5120
Expert Solution
This question has been solved!
Explore an expertly crafted, step-by-step solution for a thorough understanding of key concepts.

Step by step
Solved in 3 steps with 4 images

Knowledge Booster


Learn more about
Need a deep-dive on the concept behind this application? Look no further. Learn more about this topic, statistics and related others by exploring similar questions and additional content below.Recommended textbooks for you
College Algebra (MindTap Course List)
Algebra
ISBN:
9781305652231
Author:
R. David Gustafson, Jeff Hughes
Publisher:
Cengage Learning
College Algebra (MindTap Course List)
Algebra
ISBN:
9781305652231
Author:
R. David Gustafson, Jeff Hughes
Publisher:
Cengage Learning