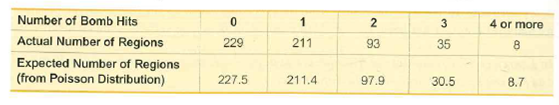
Number of Bomb Hits Actual Number of Regions Expected Number of Regions 4 or more 229 211 93 8. 35 (from Poisson Distribution) 227.5 211.4 97.9 30.5 8.7 2.


In Exercises 5–20, conduct the hypothesis test and provide the test statistic and the P-value and/or critical value, and state the conclusion.
Do World War II Bomb Hits Fit a Poisson Distribution? In analyzing hits by V-1 buzz bombs in World War II, South London was subdivided into regions, each with an area of 0.25 km2. Shown below is a table of actual frequencies of hits and the frequencies expected with the Poisson distribution. (The Poisson distribution is described in Section 5-3.) Use the values listed and a 0.05 significance level to test the claim that the actual frequencies fit a Poisson distribution. Does the result prove that the data conform to the Poisson distribution?


Trending now
This is a popular solution!

Step by step
Solved in 5 steps with 4 images


