Of the following data 22, 10, 23,14,21,19 • The Median order is 3,4 • The Median is 20 • The Median average between 19,21 • All of the above In grouped data (n) is the • Number of Frequency • Number of data • Sum of Frequeney • All of the above
Of the following data 22, 10, 23,14,21,19 • The Median order is 3,4 • The Median is 20 • The Median average between 19,21 • All of the above In grouped data (n) is the • Number of Frequency • Number of data • Sum of Frequeney • All of the above

Glencoe Algebra 1, Student Edition, 9780079039897, 0079039898, 2018
18th Edition
ISBN:9780079039897
Author:Carter
Publisher:Carter
Chapter10: Statistics
Section10.4: Distributions Of Data
Problem 19PFA

Related questions

Topic Video
Question
Q6
Q7
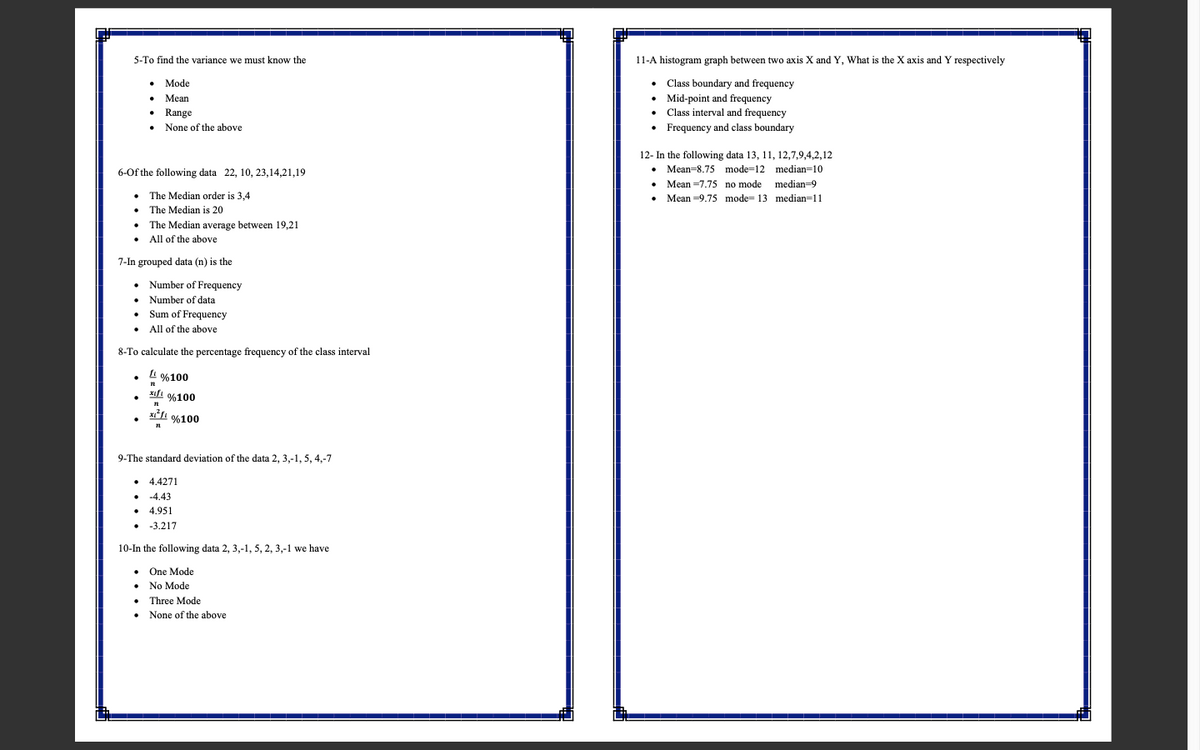
Transcribed Image Text:5-To find the variance we must know the
11-A histogram graph between two axis X and Y, What is the X axis and Y respectively
• Mode
• Mean
• Range
• None of the above
• Cass boundary and frequency
• Mid-point and frequency
• Class interval and frequency
• Frequency and class boundary
12- In the following data 13, 11, 12,7,9,4,2,12
• Mean=8.75 mode=12 median=10
6-Of the following data 22, 10, 23,14,21,19
Mean =7.75 no mode median=9
The Median order is 3,4
Mean =9.75 mode= 13 median=11
• The Median is 20
The Median average between 19,21
• All of the above
7-In grouped data (n) is the
• Number of Frequency
Number of data
Sum of Frequency
• All of the above
8-To calculate the percentage frequency of the class interval
L %100
xifi %100
Tl %100
9-The standard deviation of the data 2, 3,-1, 5, 4,-7
• 4.4271
• -4.43
• 4.951
-3.217
10-In the following data 2, 3,-1, 5, 2, 3,-1 we have
• One Mode
• No Mode
• Three Mode
• None of the above
Expert Solution
This question has been solved!
Explore an expertly crafted, step-by-step solution for a thorough understanding of key concepts.

Step by step
Solved in 2 steps

Knowledge Booster


Learn more about
Need a deep-dive on the concept behind this application? Look no further. Learn more about this topic, probability and related others by exploring similar questions and additional content below.Recommended textbooks for you
Glencoe Algebra 1, Student Edition, 9780079039897…
Algebra
ISBN:
9780079039897
Author:
Carter
Publisher:
McGraw Hill
Glencoe Algebra 1, Student Edition, 9780079039897…
Algebra
ISBN:
9780079039897
Author:
Carter
Publisher:
McGraw Hill