omplete the following table with the tax revenue collected and deadweight loss caused by each of the tax proposals. Tax Revenue Deadweight Loss If the Government Taxes... (Dollars) (Dollars) Jeans at $25 per pair Allergy medication at $25 per bottle the government wants to impose the tax that is more efficient, it should tax (Hint: Assume the administrative burdens f the two tax laws are equal.)
omplete the following table with the tax revenue collected and deadweight loss caused by each of the tax proposals. Tax Revenue Deadweight Loss If the Government Taxes... (Dollars) (Dollars) Jeans at $25 per pair Allergy medication at $25 per bottle the government wants to impose the tax that is more efficient, it should tax (Hint: Assume the administrative burdens f the two tax laws are equal.)

Essentials of Economics (MindTap Course List)
8th Edition
ISBN:9781337091992
Author:N. Gregory Mankiw
Publisher:N. Gregory Mankiw
Chapter6: Supply, Demand And Government Policies
Section: Chapter Questions
Problem 6PA

Related questions
Question
100%
the drop down options are jeans and allergy medication
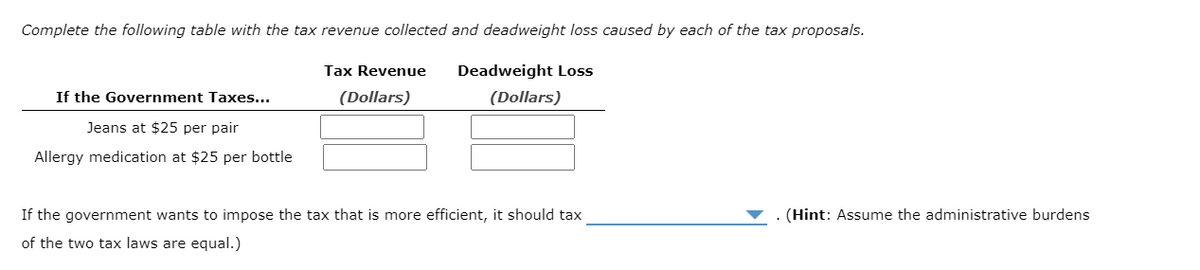
Transcribed Image Text:Complete the following table with the tax revenue collected and deadweight loss caused by each of the tax proposals.
Tax Revenue
Deadweight Loss
If the Government Taxes...
(Dollars)
(Dollars)
Jeans at $25 per pair
Allergy medication at $25 per bottle
If the government wants to impose the tax that is more efficient, it should tax
(Hint: Assume the administrative burdens
of the two tax laws are equal.)
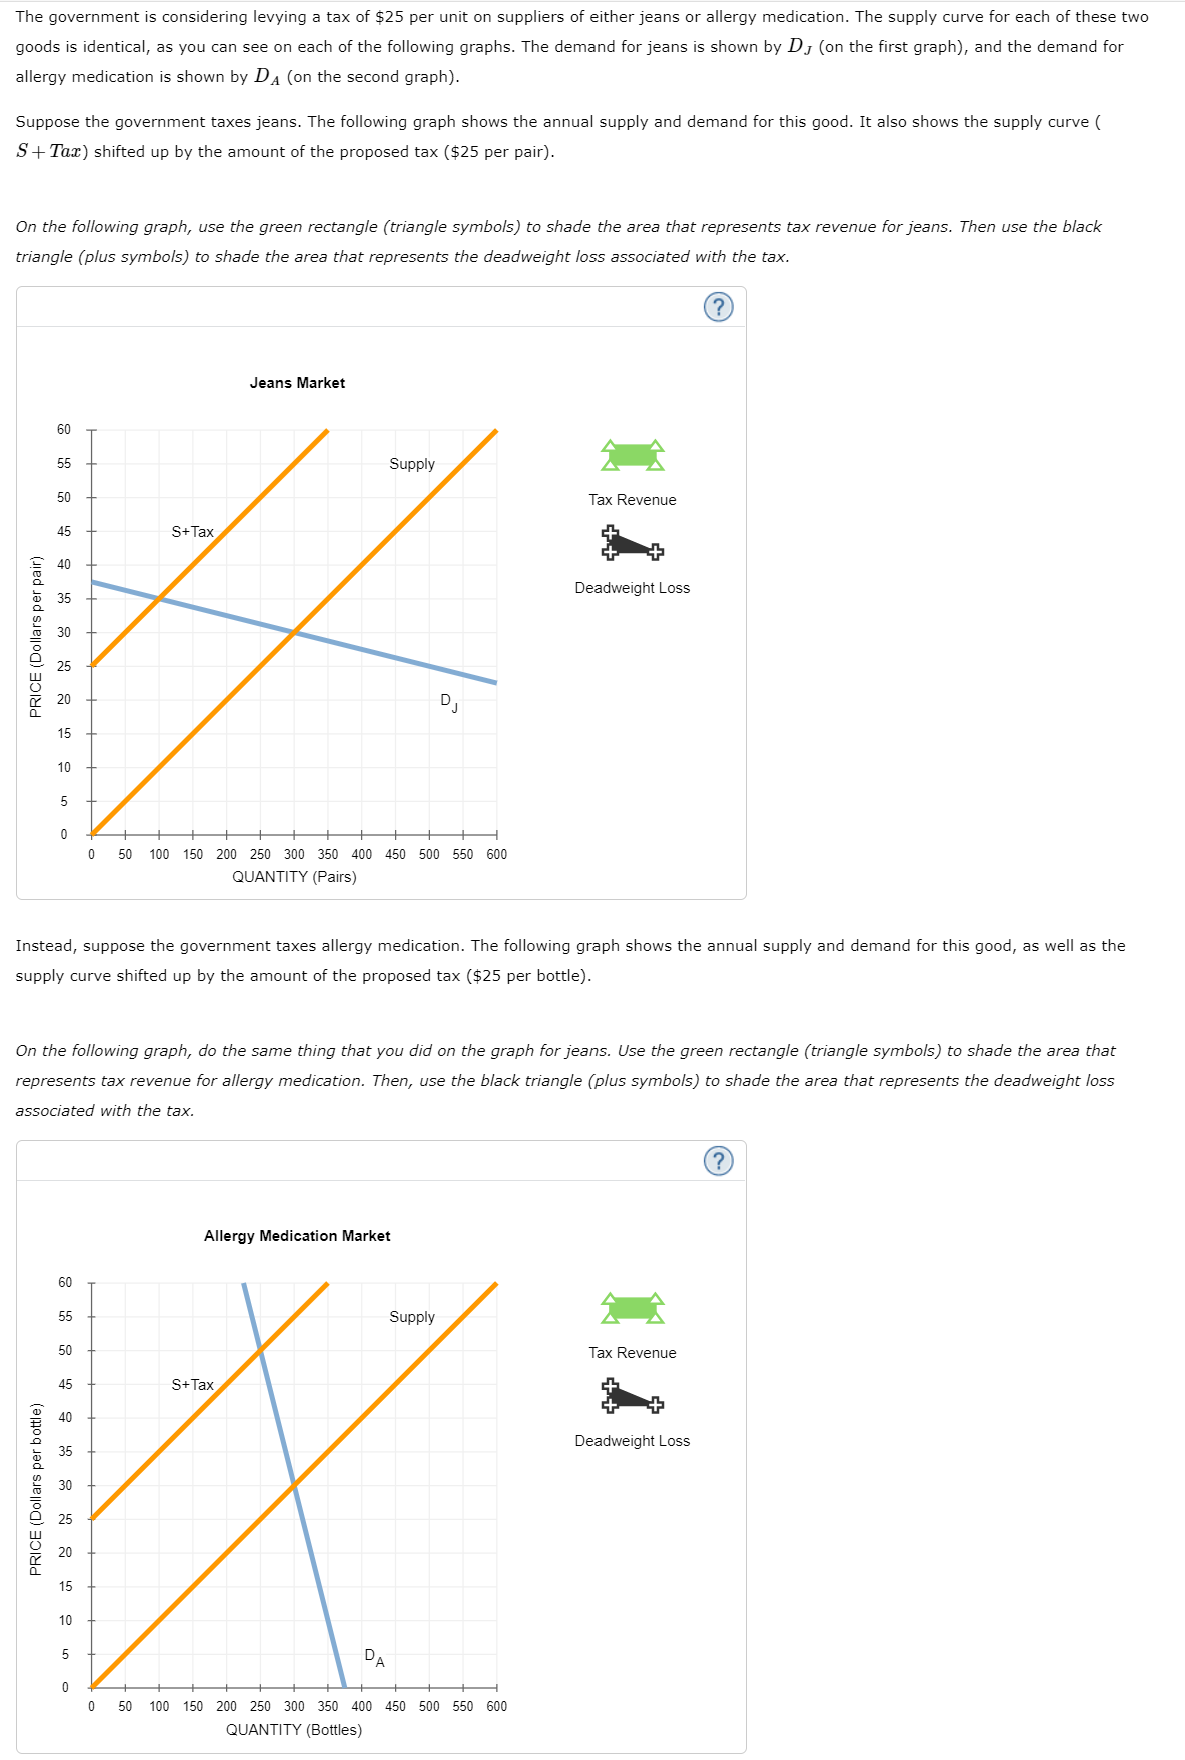
Transcribed Image Text:The government is considering levying a tax of $25 per unit on suppliers of either jeans or allergy medication. The supply curve for each of these two
goods is identical, as you can see on each of the following graphs. The demand for jeans is shown by DJ (on the first graph), and the demand for
allergy medication is shown by DA (on the second graph).
Suppose the government taxes jeans. The following graph shows the annual supply and demand for this good. It also shows the supply curve (
S+Tax) shifted up by the amount of the proposed tax ($25 per pair).
On the following graph, use the green rectangle (triangle symbols) to shade the area that represents tax revenue for jeans. Then use the black
triangle (plus symbols) to shade the area that represents the deadweight loss associated with the tax.
Jeans Market
60
55
Supply
50
Tax Revenue
45
S+Tax
40
Deadweight Loss
35
30
25
20
15
10
5
50
100 150 200 250 300 350 400 450 500 550 600
QUANTITY (Pairs)
Instead, suppose the government taxes allergy medication. The following graph shows the annual supply and demand for this good, as well as the
supply curve shifted up by the amount of the proposed tax ($25 per bottle).
On the following graph, do the same thing that you did on the graph for jeans. Use the green rectangle (triangle symbols) to shade the area that
represents tax revenue for allergy medication. Then, use the black triangle (plus symbols) to shade the area that represents the deadweight loss
associated with the tax.
Allergy Medication Market
60
55
Supply
50
Tax Revenue
45
S+Tax
40
Deadweight Loss
35
15
10
5
DA
50
100 150 200 250 300 350 400 450 500 550 600
QUANTITY (Bottles)
PRICE (Dollars per bottle)
PRICE (Dollars per pair)
Expert Solution
This question has been solved!
Explore an expertly crafted, step-by-step solution for a thorough understanding of key concepts.

This is a popular solution!

Trending now
This is a popular solution!

Step by step
Solved in 3 steps with 2 images

Knowledge Booster


Learn more about
Need a deep-dive on the concept behind this application? Look no further. Learn more about this topic, economics and related others by exploring similar questions and additional content below.Recommended textbooks for you
Essentials of Economics (MindTap Course List)
Economics
ISBN:
9781337091992
Author:
N. Gregory Mankiw
Publisher:
Cengage Learning
Essentials of Economics (MindTap Course List)
Economics
ISBN:
9781337091992
Author:
N. Gregory Mankiw
Publisher:
Cengage Learning