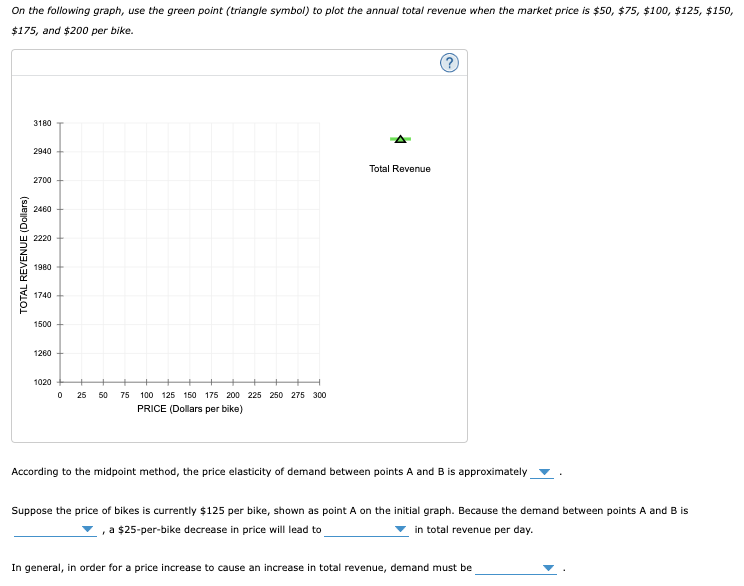
On the following graph, use the green point (triangle symbol) to plot the annual total revenue when the market price is $50, $75, $100, $125, $150, $175, and $200 per bike. 3180 2940 Total Revenue 2700 2460 2220 1980 1740 1500 1260 1020 25 50 75 100 125 150 175 200 225 250 275 300 PRICE (Dollars per bike) According to the midpoint method, the price elasticity of demand between points A and B is approximately Suppose the price of bikes is currently $125 per bike, shown as point A on the initial graph. Because the demand between points A and B is , a $25-per-bike decrease in price will lead to in total revenue per day. In general, in order for a price increase to cause an increase in total revenue, demand must be TOTAL REVENUE (Dollars)
On the following graph, use the green point (triangle symbol) to plot the annual total revenue when the market price is $50, $75, $100, $125, $150, $175, and $200 per bike. 3180 2940 Total Revenue 2700 2460 2220 1980 1740 1500 1260 1020 25 50 75 100 125 150 175 200 225 250 275 300 PRICE (Dollars per bike) According to the midpoint method, the price elasticity of demand between points A and B is approximately Suppose the price of bikes is currently $125 per bike, shown as point A on the initial graph. Because the demand between points A and B is , a $25-per-bike decrease in price will lead to in total revenue per day. In general, in order for a price increase to cause an increase in total revenue, demand must be TOTAL REVENUE (Dollars)

Microeconomics: Private and Public Choice (MindTap Course List)
16th Edition
ISBN:9781305506893
Author:James D. Gwartney, Richard L. Stroup, Russell S. Sobel, David A. Macpherson
Publisher:James D. Gwartney, Richard L. Stroup, Russell S. Sobel, David A. Macpherson
Chapter7: Consumer Choice And Elasticity
Section: Chapter Questions
Problem 13CQ: Suppose Erin, the owner-manager of a local hotel projects the following demand for her rooms: a....

Related questions
Question
Transcribed Image Text:On the following graph, use the green point (triangle symbol) to plot the annual total revenue when the market price is $50, $75, $100, $125, $150,
$175, and $200 per bike.
3180
2940
Total Revenue
2700
2460
2220
1980
1740
1500
1260
1020
25
50
75
100 125 150 175 200 225 250 275 300
PRICE (Dollars per bike)
According to the midpoint method, the price elasticity of demand between points A and B is approximately
Suppose the price of bikes is currently $125 per bike, shown as point A on the initial graph. Because the demand between points A and B is
, a $25-per-bike decrease in price will lead to
in total revenue per day.
In general, in order for a price increase to cause an increase in total revenue, demand must be
TOTAL REVENUE (Dollars)
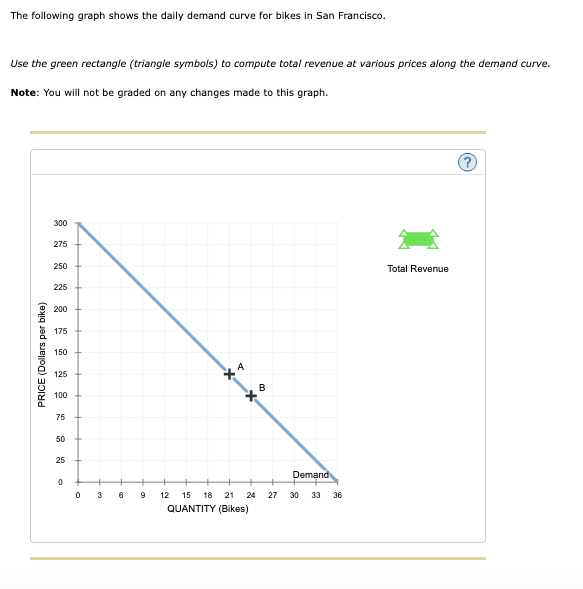
Transcribed Image Text:The following graph shows the daily demand curve for bikes in San Francisco.
Use the green rectangle (triangle symbols) to compute total revenue at various prices along the demand curve.
Note: You will not be graded on any changes made to this graph.
300
275
250
Total Revenue
225
200
175
150
125
100
75
50
25
Demand
3
9
12
15
18
21
24
27
30
33
36
QUANTITY (Bikes)
PRICE (Dollars per bike)
B.
Expert Solution
This question has been solved!
Explore an expertly crafted, step-by-step solution for a thorough understanding of key concepts.

This is a popular solution!

Trending now
This is a popular solution!

Step by step
Solved in 2 steps with 1 images

Knowledge Booster


Learn more about
Need a deep-dive on the concept behind this application? Look no further. Learn more about this topic, economics and related others by exploring similar questions and additional content below.Recommended textbooks for you
Microeconomics: Private and Public Choice (MindTa…
Economics
ISBN:
9781305506893
Author:
James D. Gwartney, Richard L. Stroup, Russell S. Sobel, David A. Macpherson
Publisher:
Cengage Learning

Economics: Private and Public Choice (MindTap Cou…
Economics
ISBN:
9781305506725
Author:
James D. Gwartney, Richard L. Stroup, Russell S. Sobel, David A. Macpherson
Publisher:
Cengage Learning

Microeconomics: Private and Public Choice (MindTa…
Economics
ISBN:
9781305506893
Author:
James D. Gwartney, Richard L. Stroup, Russell S. Sobel, David A. Macpherson
Publisher:
Cengage Learning
Economics: Private and Public Choice (MindTap Cou…
Economics
ISBN:
9781305506725
Author:
James D. Gwartney, Richard L. Stroup, Russell S. Sobel, David A. Macpherson
Publisher:
Cengage Learning

Exploring Economics
Economics
ISBN:
9781544336329
Author:
Robert L. Sexton
Publisher:
SAGE Publications, Inc

Managerial Economics: Applications, Strategies an…
Economics
ISBN:
9781305506381
Author:
James R. McGuigan, R. Charles Moyer, Frederick H.deB. Harris
Publisher:
Cengage Learning

Economics (MindTap Course List)
Economics
ISBN:
9781337617383
Author:
Roger A. Arnold
Publisher:
Cengage Learning