
Biology (MindTap Course List)
11th Edition
ISBN:9781337392938
Author:Eldra Solomon, Charles Martin, Diana W. Martin, Linda R. Berg
Publisher:Eldra Solomon, Charles Martin, Diana W. Martin, Linda R. Berg
Chapter36: Roots And Mineral Nutrition
Section: Chapter Questions
Problem 17TYU

Related questions

Concept explainers
Microbial Physiology
Microbial physiology is the branch of microbiology that is associated with studying the physiology of fungi, bacteria, and viruses. It is an important field of science concerning functional genomics and metabolic engineering.
Chemotaxis
The organism’s movement in a particular direction as a response to certain chemicals that are available in the environment is defined as chemotaxis. In brief, it can be defined as the occurrence of an organism’s movement in response to a certain chemical stimulus.
Question
One of the constants in the experiment was that the chloropyll content was measured every 48 hours.
A True
B False
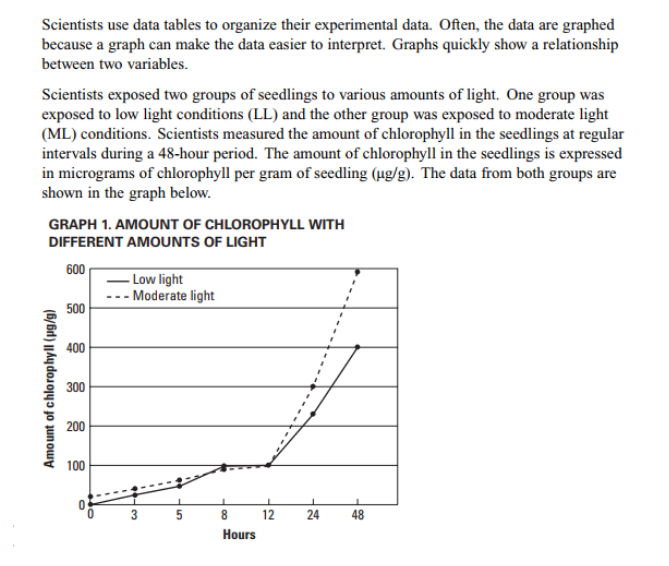
Transcribed Image Text:Scientists use data tables to organize their experimental data. Often, the data are graphed
because a graph can make the data easier to interpret. Graphs quickly show a relationship
between two variables.
Scientists exposed two groups of seedlings to various amounts of light. One group was
exposed to low light conditions (LL) and the other group was exposed to moderate light
(ML) conditions. Scientists measured the amount of chlorophyll in the seedlings at regular
intervals during a 48-hour period. The amount of chlorophyll in the seedlings is expressed
in micrograms of chlorophyll per gram of seedling (ug/g). The data from both groups are
shown in the graph below.
GRAPH 1. AMOUNT OF CHLOROPHYLL WITH
DIFFERENT AMOUNTS OF LIGHT
600
- Low light
--- Moderate light
500
400
300
200
100
5
12
24
48
Hours
Amount of chlorophyll (pg/g)
3.
Expert Solution
This question has been solved!
Explore an expertly crafted, step-by-step solution for a thorough understanding of key concepts.

This is a popular solution!

Trending now
This is a popular solution!

Step by step
Solved in 2 steps

Knowledge Booster


Learn more about
Need a deep-dive on the concept behind this application? Look no further. Learn more about this topic, biology and related others by exploring similar questions and additional content below.Recommended textbooks for you
Biology (MindTap Course List)
Biology
ISBN:
9781337392938
Author:
Eldra Solomon, Charles Martin, Diana W. Martin, Linda R. Berg
Publisher:
Cengage Learning

Biology (MindTap Course List)
Biology
ISBN:
9781337392938
Author:
Eldra Solomon, Charles Martin, Diana W. Martin, Linda R. Berg
Publisher:
Cengage Learning