onsider the following information regarding the dividends paid per share by companies in the banking, ansportation, and energy industries. Does the data provide evidence to conclude that there is a significant ifference among the average dividends paid per share for the three different industries? Companies Banking Transportation Energy 1.52 1.00 2.08 1.19 0.35 1.28
onsider the following information regarding the dividends paid per share by companies in the banking, ansportation, and energy industries. Does the data provide evidence to conclude that there is a significant ifference among the average dividends paid per share for the three different industries? Companies Banking Transportation Energy 1.52 1.00 2.08 1.19 0.35 1.28

MATLAB: An Introduction with Applications
6th Edition
ISBN:9781119256830
Author:Amos Gilat
Publisher:Amos Gilat
Chapter1: Starting With Matlab
Section: Chapter Questions
Problem 1P

Related questions
Question
Help me please
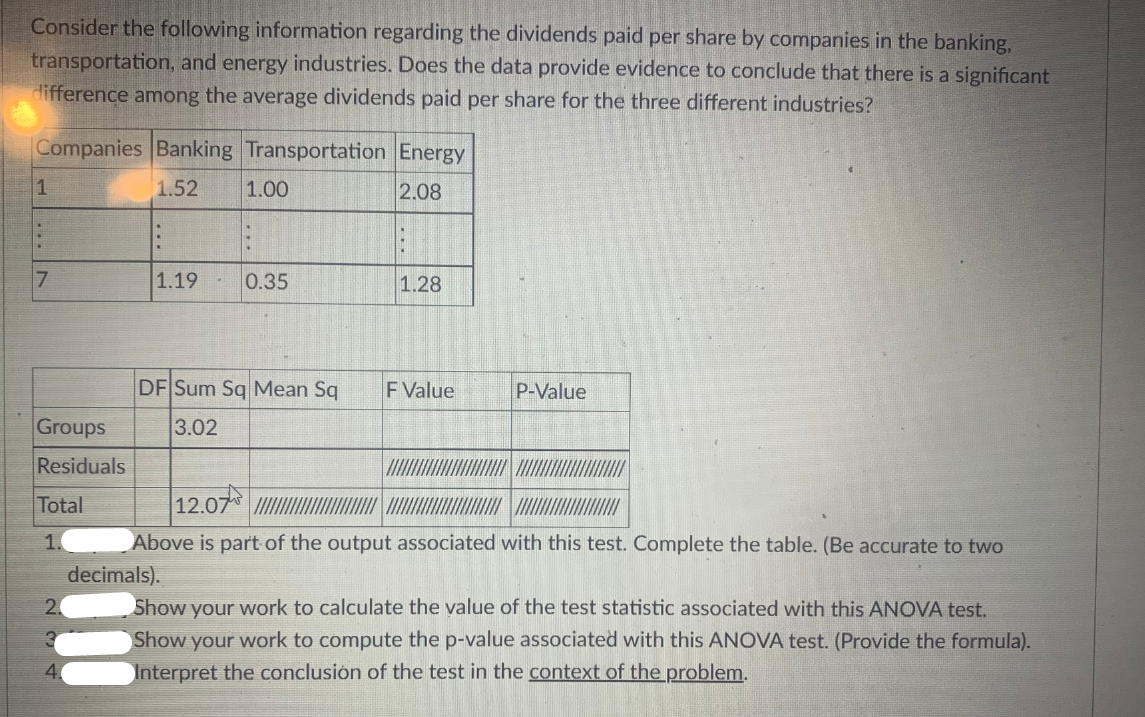
Transcribed Image Text:Consider the following information regarding the dividends paid per share by companies in the banking,
transportation, and energy industries. Does the data provide evidence to conclude that there is a significant
difference among the average dividends paid per share for the three different industries?
Companies Banking Transportation Energy
1
1.52
1.00
2.08
7
1.19
0.35
1.28
DF Sum Sq Mean Sq
F Value
P-Value
Groups
3.02
Residuals
Total
12.07
1.
Above is part of the output associated with this test. Complete the table. (Be accurate to two
decimals).
Show your work to calculate the value of the test statistic associated with this ANOVA test.
Show your work to compute the p-value associated with this ANOVA test. (Provide the formula).
Interpret the conclusión of the test in the context of the problem.
2.
4.
Expert Solution
This question has been solved!
Explore an expertly crafted, step-by-step solution for a thorough understanding of key concepts.

This is a popular solution!

Trending now
This is a popular solution!

Step by step
Solved in 2 steps

Recommended textbooks for you
MATLAB: An Introduction with Applications
Statistics
ISBN:
9781119256830
Author:
Amos Gilat
Publisher:
John Wiley & Sons Inc

Probability and Statistics for Engineering and th…
Statistics
ISBN:
9781305251809
Author:
Jay L. Devore
Publisher:
Cengage Learning

Statistics for The Behavioral Sciences (MindTap C…
Statistics
ISBN:
9781305504912
Author:
Frederick J Gravetter, Larry B. Wallnau
Publisher:
Cengage Learning
MATLAB: An Introduction with Applications
Statistics
ISBN:
9781119256830
Author:
Amos Gilat
Publisher:
John Wiley & Sons Inc
Probability and Statistics for Engineering and th…
Statistics
ISBN:
9781305251809
Author:
Jay L. Devore
Publisher:
Cengage Learning
Statistics for The Behavioral Sciences (MindTap C…
Statistics
ISBN:
9781305504912
Author:
Frederick J Gravetter, Larry B. Wallnau
Publisher:
Cengage Learning

Elementary Statistics: Picturing the World (7th E…
Statistics
ISBN:
9780134683416
Author:
Ron Larson, Betsy Farber
Publisher:
PEARSON

The Basic Practice of Statistics
Statistics
ISBN:
9781319042578
Author:
David S. Moore, William I. Notz, Michael A. Fligner
Publisher:
W. H. Freeman

Introduction to the Practice of Statistics
Statistics
ISBN:
9781319013387
Author:
David S. Moore, George P. McCabe, Bruce A. Craig
Publisher:
W. H. Freeman